



COMPARATIVE QUALITY ASSESSMENT OF MARKETED SILYMARIN TABLETS
HTML Full TextCOMPARATIVE QUALITY ASSESSMENT OF MARKETED SILYMARIN TABLETS
Barole Sachin Shamkant and Ashwani Kumar *
University Institute of Pharmaceutical Sciences, Punjab University, Chandigarh, India.
ABSTRACT: In recent years, the popularity of silymarin, lauded for their nutritional and health benefits, has soared. Among these products, silymarin and its main constituent, silibinin, have a hepatoprotective effect due to their antioxidant activity as well as a membrane-stabilizing property that inhibits or stops the process of lipid peroxidation. Additionally, they may help avoid gallbladder and spleen diseases. It’s anti-inflammatory, anti-cancer, anti-oxidant, and anti-diabetic qualities are well known. However, challenges related to standardization and quality control persist in the realm of herbal medicines, including silymarin supplements. This study aimed to evaluate the quality of widely used silymarin tablets from three different commercial brands, employing established pharmacopeia standards. Parameters assessed included post-formulation characteristics (diameter, thickness, hardness, friability, weight variation, and disintegration) and quantification of silibinin using high-performance liquid chromatography (HPLC). The findings confirmed that the investigated silymarin tablets adhered to specified post-formulation parameters, reinforcing their reliability as dietary supplements. The silibinin content determined by HPLC was found to be 40.60, 40.39 mg and 60.17 mg per tablet respectively.
Keywords: Silymarin, HPLC, Silybinin, Tablets, Flavonoids, Quantification
INTRODUCTION: Silymarin is a mixture of several flavonoid-like compounds that are derived from the hard fruits, also known as kenguil seeds, of the milk thistle plant, Silybum marianum L. Gaertn 1, 2. This plant is widely grown in Europe and Asia, including India. The medication is a member of the flavonolignans class of chemicals, which are most likely generated in plants by a radical coupling of flavonoids and coniferyl alcohol 3. Various brands of commercially standardized milk thistle extracts may have various silymarin compositions and individual ingredient ratios 4.
There is a significant quantity of pharmaco-toxicological and clinical data available for the primary component silybin 5. Since silymarin has low water solubility and limited bioavailability, it is complexed with β-cyclodextrin, phosphatidylcholin, or even administered as glycosides, which have higher action and better water solubility. Silymarin and its main constituent, silibinin, have a hepatoprotective effect due to their antioxidant activity as well as a membrane-stabilizing property that inhibits or stops the process of lipid peroxidation 6.
Additionally, they may help avoid gallbladder and spleen diseases. It’s anti-inflammatory, anti-cancer, anti-oxidant, and anti-diabetic qualities are well known 7-11.
MATERIAL AND METHODS: Three different commercial brands of silymarin tablets were purchased from Pharmeasy (online). The standard silybinin was purchased from TCI, Japan.
Evaluation of Post Formulation Parameters: The tablets were subjected to post-formulation parameters (visual inspection, hardness, friability, uniformity in weight and disintegration time) evaluation.
Visual Inspection and Dimensions: Randomly selected 10 tablets of each brand were visually inspected for surface smoothness and chipping defects. Diameter and thickness of the tablets was measured using vernier calipers.
Hardness: Randomly selected 10 tablets of each brand were tested for hardness using Pfizer hardness tester by placing the tablets between the edges of the tester. The force required to crush the tablet was noted.
Friability: Randomly selected 10 tablets of each brand were subjected for friability test using Roche’s friabilator instrument.
Weight Variation: Twenty tablets were randomly selected from each brand and were accurately weighed. Percentage deviation in weight of each tablet was calculated from the average weight. Tablet is more than 250 mg therefore acceptable % deviation will be 5% according to USP, 2014.
Disintegration Test: Six tablets randomly selected from each brand were allowed to disintegrate in water at room temperature (25 ± 2 °C), using Lab India DT 1000 disintegration test apparatus (AYUSH, 2018). Time taken by the tablets to disintegrate completely was noted.
HPLC Analysis of Silibinin in Tablets:
Chromatographic Conditions: Waters HPLC system was used for the studies using C18 reverse phase column at ambient temperature. An isocratic HPLC method was developed to determine the Silibinin content in silymarin tablets, with methanol has proved to be the method of choice for the analysis of flavonolignans. Mobile phases consisted of HPLC-grade water (A) and Methanol (B) The ratio of the mobile phase was A: B (50:50). Run time was 10 min, whereas injection volume was 10 µL. The detection wavelength was 288 nm and the flow rate was 0.8 ml/min.
The Silibinin content was determined by using HPLC-UV. All the standard and test samples were injected in triplicate.
Preparation of Standard Stock Solution: Silibinin (5 mg) was weighed accurately and dissolved in 5 ml of methanol to obtain a concentration of 1 mg/mL. The stock solution was further diluted with methanol to obtain the final concentration of 500µg/mL.
Preparation of Test Solution: Weighed about 30 mg of powdered drug samples accurately and took it into a 10 ml volumetric flask. 10 ml of methanol was added followed by sonication for 30 min. The solution was filtered using a 0.22 µm syringe filter prior to analysis by taking 1 ml from final stock solution of sample and was appropriately diluted. The sample solution (10 µL) was injected into the HPLC system. The whole process was carried out in duplicate.
Validation of Analytical Method: The developed analytical method was validated in accordance with the ICH guidelines (2005). Validation was done by determining the following parameters.
System Suitability Testing: System suitability test was carried out by injecting Silibinin standard solutions at a concentration of 300 µg/ml six-times. The result obtained showed that the conditions used for the determination of the levels of Silibinin in the sample has good system suitability based on retention time, peak area and peak height requirements, % RSD ≤2%.
Linearity: The linearity of an analytical procedure is its ability (within a given range) to obtain test results which are directly proportional to the concentration of analyte in the sample. Two replicates of Silibinin standard solutions at 1 mg/ml were diluted in methanol to five different concentrations 100µg/mL, 200µg/mL, 300µg/mL, 400µg/mL, and 500µg/mL. A calibration curve for concentration versus absorbance was plotted and the obtained data were subjected to regression analysis using the least square method.
Accuracy (Recovery Studies): The accuracy of an analytical method is the closeness of test results obtained by that method to the true value.
It is usually determined based on the known amount of analyte in the sample. This is performed by spiking sample with analyte. For assay methods, spiked samples were prepared in triplicate at 3 levels over a range of 50-150% of the target concentration. The data reported as % recovery of the known added amount or as the difference between mean and through value within the confidence interval (± S.D.).
Precision: It is defined as closeness of agreement among individual test results from repeated analysis of a homogeneous sample. It is performed at three different levels of repeatability, intermediate precision, and reproducibility.
Repeatability (Intra-Day Assay Precision): It is the ability of the test method to generate the same results over an age-short time interval under identical conditions. It is determined from a minimum of 6 determinations at 100% of the test or target concentration. The results for an assay method are summarized in % RSD.
Intermediate Precision (Inter-Day Assay Precision): It refers to agreements between the results from within the lab and variations due to random events such as different days, analysts, equipment etc. That might normally occur during the use of a test method. It is calculated by employing 2 analysts from different labs preparing 6 sample preparations from one batch of sample and two preparations each from two additional batches for analysis. That data from each analyst is pooled and the acceptance criteria for intermediate precision is within 2%.
Reproducibility: It is determined by testing homogeneous samples in multiple labs. The assay results should include standard deviation, relative standard deviation, and confidence interval. The acceptance criteria is within 2%.
Limit of Detection (LOD) and Limit of Quantification (LOQ): LOD is defined as the lowest amount of analyte that can be detected above baseline noise; typically, three times the noise level. LOQ is defined as the lowest amount of analyte which can be reproducibly quantitated above baseline noise. Where, σ is the standard error of the intercept and S is the slope of the calibration curve.
RESULTS AND DISCUSSION: The present study aims to assess the quality of silymarin tablets of three different commercially available brands of tablets to investigate the identification, quantification, method validation and total content of the Silibinin.
Evaluation of Post-Formulation Parameters: The physical properties of the tablets were determined and the results of hardness, friability and weight variation for three different brands of tablets are depicted in Table 4, respectively. Hardness studies indicated the strength of tablets. In general, tablets should be sufficiently hard to resist breaking during normal handling, and yet soft enough to disintegrate properly after swallowing. A force of 4 kg/cm2 is considered as minimum requirement for a satisfactory tablet. Limit for hardness value for tablets as per USP is 4 -10 kg/cm2. All brands of Silymarin tablets passed the limits for hardness. The values were > 4 kg/cm2 and < 10 kg/cm2.
Low friability indicates that the tablets are compact and hard. Conventional compressed tablets that lose less than 1% of their weight are generally considered acceptable. Tablets of all three drugs were observed to conform to the laid down standards. Because of film coated tablets friability loss doesn’t come. In-vitro disintegration studies were directly related to the bioavailability of tablets. Too high disintegration time means that the tablet is too highly compressed. But this result did not really imitate how the preparation would disintegrate in human body. All the tablets complied with disintegration limits as per ICH guidelines. Table 1 indicates result of post-formulation parameters.
TABLE 1: RESULT OF POST-FORMULATION PARAMETERS
| Sr. no. | Evaluation parameters | Tablet 1 | Tablet 2 | Tablet 3 |
| 1 | Thickness (cm)* | 0.44±0.01 | 0.41±0.01 | 0.46±0.01 |
| 2 | Diameter (cm)* | 1.2±0.01 | 0.99±0.01 | 1.2±0.01 |
| 3 | Hardness (kg/cm2)* | 4.8±0.16 | 8±0.22 | 6.8±0.12 |
| 4 | % Friability* | 0.12±0.01 | 0.23±0.01 | 0.21±0.01 |
| 5 | Weight variation (%RSD) | 1.00 | 1.46 | 1.98 |
| 6 | Average weight (g)* | 0.406±0.41 | 0.299±0.46 | 0.488±0.44 |
| 7 | Disintegration time (min)* | 6.2±0.18 | 8.27±0.26 | 9.13±0.21 |
*Data are given as average ± Standard Deviation
HPLC Analysis:
Quantification of Silibinin in Silymarin Tablets: Our analytical method allows a quick and reliable determination of Silibinin. A five-point calibration curve was plotted for Silibinin in the concentration range of 100-500 µg/mL. The regression equation (y = 37747x - 1327380) showed excellent coefficient of correlation (R² = 0.99) over a wide range with low intercept value. Fig. 1A represents Chromatogram of Standard Silibinin and Fig. 1B shows Overlay chromatogram of standard Silibinin and sample.
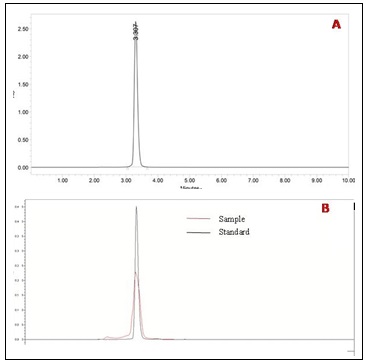
FIG. 1: (A) CHROMATOGRAM OF STANDARD SILIBININ (B) OVERLAY CHROMATOGRAM OF STANDARD SILIBININ AND SAMPLE
Analytical method for quantification of Silibinin was validated for different parameters given in Table 2. The retention time of Silibinin in all three brands of tablets was 3.2-3.3 minutes and it was remains consistent, indicating that the formulation and manufacturing processes do not significantly affect the retention time of silymarin. The peak purity analysis confirms that the Silibinin peak obtained from all three brands is pure, without any interference from other components present in the tablets.
Specificity: There was no interfering peak near to silybinin peak in the sample. The blank injection did not show any peak. Thus, the method was found to be specific.
Precision: Intra-day and inter-day precision were calculated as % RSD. The standard silybinin 100 µg/ml was used for this study. The calculated % RSD was less than 2% indicating good precision. The results are given in Table 3 and 4.
TABLE 2: RESULTS OF METHOD VALIDATION
| Sr. no. | Parameters | Values | |
| 1 | System suitability (%RSD) | 0.30 | |
| 2 | Instrumental precision (%RSD, n=6) | 0.21 | |
| 3 | Specificity | Specific | |
| 4 | Linearity (coefficient of correlation) | 0.99 | |
| 5 | Linearity range (µg/mL) | 100-500 | |
| 6 | LOD (µg) | 0.3 | |
| 7 | LOQ (µg) | 1.0 | |
| 8 | Accuracy (average % recovery studies) | 99.33 % | |
| 9 | Precision | Intra-day (%RSD) (n=3) | 0.25% |
| Inter-day (%RSD) (n=3) | 0.26% | ||
TABLE 3: RESULTS OF INTRA-DAY PRECISION
| Injection no. | Silybinin Conc. (µg/mL) | Morning AUC | Afternoon AUC | Evening AUC | %RSD |
| 1 | 100 | 2832515 | 2841776 | 2857740 | 0.25 |
| 2 | 100 | 2841534 | 2834416 | 2834497 | |
| 3 | 100 | 2834618 | 2841164 | 2841102 | |
| 4 | 100 | 2832998 | 2839700 | 2849613 | |
| 5 | 100 | 2833840 | 2839480 | 2844280 | |
| 6 | 100 | 2832910 | 2833112 | 2849960 | |
| Average | 2839736 ±7125 | ||||
TABLE 4: RESULTS OF INTER-DAY PRECISION
| Injection no. | Silybinin Conc. (µg/mL) | Day 1 AUC | Day 2 AUC | Day 3 AUC | %RSD |
| 1 | 100 | 2832515 | 2841864 | 2845764 | 0.26 |
| 2 | 100 | 2841534 | 2834986 | 2854986 | |
| 3 | 100 | 2834618 | 2841871 | 2849965 | |
| 4 | 100 | 2832998 | 2839100 | 2844412 | |
| 5 | 100 | 2833840 | 2839970 | 2854254 | |
| 6 | 100 | 2832910 | 2833223 | 2848877 | |
| Average | 2840983±7457 | ||||
Linearity: A five-point calibration curve was plotted for Silibinin in the concentration range of 100-500 µg/mL Table 5. The regression equation (y = 37747x - 1327380) showed and excellent coefficient of correlation (R² = 0.99) over a wide range with low intercept value Fig. 2.
TABLE 5: RESULT OF LINEARITY
| Silybinin Conc. (µg/mL) | Average AUC | SD | %RSD |
| 100 | 2894394 | 3965.26 | 0.14 |
| 200 | 5875287 | 19752.43 | 0.34 |
| 300 | 9271896 | 26166.34 | 0.28 |
| 400 | 14473131 | 21785.82 | 0.15 |
| 500 | 17469014 | 32458.67 | 0.19 |
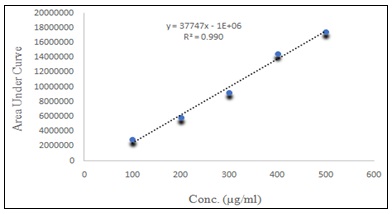
FIG. 2: CALIBRATION CURVE OF SILIBININ
LOD and LOQ: The LOD and LOQ for the silibinin peak in the sample was found to be 0.3 and 1.0 µg/ml respectively.
Accuracy: The recovery studies of Silibinin were performed by the addition of the standard (Silibinin) into the silymarin tablet samples. The spiked samples were then processed through the given procedure. The mean recoveries are given in Table 6.
TABLE 6: RESULTS OF ACCURACY
| % Level Spiked | % Recovery | Mean Recovery | % RSD |
|
50 |
98.4 |
99.14 |
0.65 |
| 99.6 | |||
| 99.43 | |||
|
100 |
98.8 |
99.5 |
0.75 |
| 99.55 | |||
| 100.3 | |||
|
150 |
99.6 |
99.33 |
0.34 |
| 98.95 | |||
| 99.46 |
This study reports the quantification of Silibinin by the HPLC method. The Silibinin content of three different samples was Tab. 1– 40.6 mg, Tab. 2– 40.39 mg and Tab. 3– 60.17 mg per tablet, respectively.
CONCLUSION: The present study was designed to assess the quality of different commercially available brands of Silymarin tablets. The tablets conformed to all the post formulation parameters like weight variation, hardness, thickness, disintegration time and friability. The validated HPLC method was used for quantification of silybinin in the tablets. The content of silybinin can be correlated to the silymarin content in the tablets.
ACKNOWLEDGEMENTS: The financial assistance from Panjab University, Chanigarh-160014 is gratefully acknowledged.
CONFLICT OF INTEREST: The authors declare that no conflicts of interest exist related to this research. The authors alone are responsible for the content and writing of this manuscript.
REFERENCES:
- Abenavoli L, Capasso R, Milic N and Capasso F: Milk thistle in liver diseases: Past, present, future. Phytotherapy Research 2010; 24: 1423-32.
- Keservani RK and Sharma AK: Flavonoids: Emerging trends and potential health benefits. J Chinese Pharm Sci 2014; 23: 815-9.
- Abou Zid S: Silymarin, natural flavonolignans from milk thistle. phytochemicals - a global perspective of their role in nutrition and health. Rijeka Croatia 2012; 255-72.
- Sayyah M, Boostani H, Pakseresht S and Malayeri A: Comparison of Silybum marianum (L.) Gaertn. with fluoxetine in the treatment of Obsessive-Compulsive Disorder. Progress in Neuro-Psychopharmacology and Biological Psychiatry 2010; 34: 362-65.
- Shaker E, Mahmoud H and Mnaa S: Silymarin, the antioxidant component and Silybum marianum extracts prevent liver damage. Food and Chemical Toxicology 2010; 48: 803-6.
- Lee JI, Narayan M and Barrett JS: Analysis and comparison of active constituents in commercial standardized silymarin extracts by liquid chromatography–electrospray ionization mass spectrometry. J Chromatogr B 2007; 84: 95–103.
- Scott Luper ND: A review of plants used in the treatment of liver disease: part 1. Altern Med Rev 1998; 3: 410–21.
- Gazak R, Walterova D and Kren V: Silybin and silymarin-new and emerging applications in medicine. Curr Med Chem 2007; 14: 315–38.
- Ramasamy K and Agarwal R: Multitargeted therapy of cancer by silymarin. In Cancer Letters 2008; 269: 352-62.
- Liang Q, Wang C, Li B and Zhang A hua: Metabolic fingerprinting to understand therapeutic effects and mechanisms of silybin on acute liver damage in rat. Pharmacogn Mag 2015; 11: 586.
- Fraschini F, Demartini G and Esposti D: Pharmacology of msilyarin. In Clinical Drug Investigation 2002; 22: 51-65.
How to cite this article:
Shamkant BS and Kumar A: Comparative quality assessment of marketed Silymarin tablets. Int J Pharm Sci & Res 2026; 17(8): 2507-12. doi: 10.13040/IJPSR.0975-8232.17(8).2507-12.
All © 2026 are reserved by International Journal of Pharmaceutical Sciences and Research. This Journal licensed under a Creative Commons Attribution-NonCommercial-ShareAlike 3.0 Unported License.
Article Information
27
2507-2512
579 KB
272
English
IJPSR
Barole Sachin Shamkant and Ashwani Kumar *
University Institute of Pharmaceutical Sciences, Punjab University, Chandigarh, India.
bashwani@pu.ac.in
15 April 2026
25 May 2026
19 June 2026
10.13040/IJPSR.0975-8232.17(8).2507-12
01 August 2026
 Download