




DEVELOPMENT AND VALIDATION OF A DENSITOMETRIC HPTLC METHOD FOR QUANTIFICATION OF OPUNTIOL IN OPUNTIA ELATIOR MILL.
HTML Full TextDEVELOPMENT AND VALIDATION OF A DENSITOMETRIC HPTLC METHOD FOR QUANTIFICATION OF OPUNTIOL IN OPUNTIA ELATIOR MILL.
S. V. Padhare and S. A. Khan *
Institute of Pharmaceutical Education and Research, Borgaon (Meghe), Wardha, Maharashtra, India.
ABSTRACT: Opuntiol is a biologically active flavonol present in Opuntia elatior Mill. (Cactaceae) that exhibits significant pharmacological activities such as antioxidant, anti-inflammatory, and anticancer effects. Reliable analytical methods are therefore required for the quantitative estimation in plant extracts and pharmaceutical preparations. The present study aimed to develop and validate a rapid, sensitive, and reproducible densitometric HPTLC method for the quantification of Opuntiol. Opuntiol was isolated from the fruits of Opuntia elatior using column chromatography, and its purity was confirmed by TLC and UV spectroscopy. Chromatographic separation was achieved on silica gel 60 F254 plates using an optimized mobile phase consisting of ethyl acetate: water: formic acid: glacial acetic acid: n-hexane (7:1:1.1:1.1:5 v/v). Densitometric scanning was performed at 280 nm, yielding a well-resolved band with an Rf value of 0.42 ± 0.002. The method showed excellent linearity in the range of 10–120 ng/spot with a correlation coefficient of 0.9956. The limits of detection and quantification were 10.14 ± 3.04 ng/spot and 30.74 ± 9.24 ng/spot, respectively. Precision studies demonstrated %RSD values below 2%, confirming excellent repeatability and intermediate precision. The robustness of the developed method was found within acceptable limits, with %RSD values ≤2%, indicating that the method is robust and can tolerate minute deliberate changes. The accuracy study was assessed at three different concentrations: 80, 120, and 150 ng/spot. The percentage mean recoveries were accurate, with <5% deviation and 3–8% RSD, indicating method excellence. The validated HPTLC method is simple, rapid, precise, and suitable for routine quality control and standardization of Opuntia in Opuntia species and related herbal formulations.
Keywords: Opuntia elatior, Opuntiol, HPTLC method development, Validation
INTRODUCTION: ‘Opuntiol’ is an important phytoactive present in the fruits and cladodes of the cactus Opuntia elatior Mill. (Nagaphani) as well as in other species of the genus Opuntia, which belong to the family “Cactaceae” 1.
It is a potential bioactive with diverse biological activities, such as anti-arthritic 2, anti-inflammatory 3, used to treat glioblastoma 4, a powerful antioxidant 5-6, and an anticancer agent 7.
It belongs to the class of flavonoids, particularly the subclass ‘flavonol,’ structurally characterized as a glycosylated flavonoid derivative 6, 8. Opuntiol has demonstrated a crucial role in modulating the inflammatory pathways by inhibiting pro-inflammatory cytokines and oxidative stress markers.
This makes Opuntia a promising candidate for the development of novel antioxidant, anti-inflammatory, and anticancer agents in the field of phytomedicine and novel drug development 9. Phytoconstituents in plant matrices are routinely analyzed using chromatographic techniques like TLC, HPTLC, HPLC, GC, LC–MS, and GC–MS 10-13. Among these, HPTLC and HPLC are the most widely used analytical techniques for both qualitative and quantitative analysis. The HPTLC analytical method development and validation play a pivotal role in new drug discovery, drug development, phytochemical estimation, and pharmaceutical product manufacturing 14.
Some investigations use HPTLC for the identification of various phytoconstituents in the cactus Opuntia. The HPTLC method was developed for the crude ethanolic extract of Opuntia dillenii cladodes, employing a chloroform:methanol (9:1) mixture as the solvent system, and detected 12 and 13 bands at 254 and 366 nm, respectively 15. The betacyanins were separated and estimated by HPTLC from the fruits of Opuntia boldinghii Br 16. The HPTLC analysis of the alcoholic extract of the fruits of Opuntia elatior Mill. was performed using toluene:ethyl acetate:acetic acid (7:3:1) as the mobile phase, observing 4 spots in short UV and 2 spots in long UV, with Rf values of 0.04 and 0.97 being common 17.
Accurate analytical methods are essential for the standardization and quality control of herbal medicines. Although several chromatographic techniques have been reported for the analysis of phytoconstituents in Opuntia species, to date, no information is available regarding the quantitative estimation of Opuntiol using a validated densitometric HPTLC method. Development of such methods is important for routine quality control, phytochemical profiling, and pharmaceutical formulation analysis.
Thus, the present investigation attempts to develop and validate a novel, sensitive, rapid, precise, and robust densitometric HPTLC method, by International Council for Harmonisation (ICH), guidelines Q2 (R1) for Opuntiol estimation in various Opuntia species using an in-house isolated and spectrally characterized (FT-IR, ¹H-NMR, ¹³C-NMR, GC-MS, and ideally single-crystal XRD; information provided in supplementary files) reference standard, because Opuntiol is not commercially available as a certified reference standard from any major supplier. This method enables the standardization of Opuntiol in various extracts of Opuntia species.
MATERIALS AND METHODS:
Materials: The fully matured, dark red colored fruits of Opuntia elatior Mill. (Cactaceae), commonly known as “nagphani,” were collected from the local areas of Mahakal, Wardha, Maharashtra, India, in the months of June-July and November-December. Fruits were identified and authenticated by an expert botanist, with a specimen voucher number 08/Botany/2021-22. Opuntiol was separated from the fruits of Opuntia elatior Mill. Fruits were collected from the local areas of Mahakal, Wardha, India.
Chemicals: The solvents used for extraction, separation, and analysis were of analytical grade (Loba Chemie, India). HPLC-grade water, ethyl acetate, glacial acetic acid, formic acid, and n-hexane were used for HPTLC and purchased from Loba Chemie, India. HPTLC precoated silica gel 60F254 plates (60F254, Merck, Germany) were used for the experiment.
Extraction and Separation of Opuntiol: The fresh fruits of Opuntia elatior Mill. were collected, thoroughly washed, and extracted with hydro-alcoholic solvent (1:1 ratio) for up to 8 days. The extract was filtered, concentrated, and then fractionated with solvents of increasing polarity, such as petroleum ether, n-hexane, toluene, and ethyl acetate. Each fraction was collected and dried in an oven at 40°C. Amongst these fractions, the ethyl acetate fraction was taken into consideration on the basis of TLC analysis for further isolation of phytoconstituents by column chromatography. Pure crystals of Opuntiol were separated by eluting the column with hexane and ethyl acetate at a ratio of 1:1 (50:50). TLC of crystals was carried out, and the purity of Opuntiol was further analyzed by HPTLC.
Sample Preparation: Accurately weighed 10 mg of Opuntiol was solubilized in 10 ml (water: methanol; 20:80% v/v; 1000 µg/ml), and further serially diluted to obtain a desired concentration of solution of 10 µg/ml. Fresh samples were prepared every day for analysis. It showed maximum UV absorbance (λmax) at 280 nm; hence, 280 nm was used throughout the analysis of Opuntia.
Instrumentation: The precoated aluminum plates (10 cm × 10 cm) of silica gel G60 F254 (E. Merck, Darmstadt, Germany), with 250 μm thickness, pre-washed with methanol for up to 10 min and heated for 20 min at 110°C, were used for chromatography.
The standard working solution of Opuntiol was applied using a CAMAG Linomat V semiautomatic applicator (Muttenz, Switzerland) fitted with a 100 μl Hamilton syringe (Switzerland). The application was carried out in band form at an application rate of 10 µL/s, with each band measuring 6 mm in width and a spacing of 6 mm between bands.
The sample was applied from the bottom at 1 cm above and 1.5 cm from the side edges. The plate was developed to approximately 8 cm, and scanning was performed at 280 nm. A 10 μg/ml working stock solution of Opuntiol was prepared, and different volumes of working standard were applied from 1 μl to 12 μl on the HPTLC plate so as to obtain the concentrations of 10 to 120 ng/spot, respectively. A 6 mm × 0.45 mm slit dimension was maintained, and a 20 mm/s scanning speed was set. The optimized solvent system comprised ethyl acetate, water, formic acid, glacial acetic acid, and n-hexane in the ratio of 7:1:1.1:1.1:5 (v/v), and 15.2 ml of the total solvent system was employed for each chromatographic run. The linear ascending development method was implemented in a twin-trough CAMAG glass chamber (100 mm × 100 mm; Muttenz, Switzerland) that had been previously equilibrated with the solvent system. 20 min was set as the optimized chamber equilibration time, at 25°C ± 2 room temperature, and 40% ± 5 relative humidity. After development, the HPTLC plates were dried using an air dryer. The CAMAG TLC scanner III with automated WINCAT software (1.4.2) (Camag, Muttenz, Switzerland) was used to perform the densitometric scanning at 280 nm.
Statistical Analysis: Data were analyzed using WINCAT software (1.4.2). The results were expressed as mean ± standard deviation (SD). Linear regression analysis was used to generate the calibration curve, and relative standard deviation (%RSD) was calculated to assess precision and robustness. Standard deviation of Response (σ) is calculated using the STEYX Excel function.
Method Development and Optimization: The HPTLC method was developed after screening several mobile-phase combinations. A quercetin-based solvent system (toluene: ethyl acetate: methanol, 50:30:20 v/v) structural similarity of Opuntiol to flavonols;; however, this solvent system failed to achieve adequate chromatographic resolution.
The HPTLC method was developed to quantify the Opuntiol. For that, ethyl acetate and water were used to obtain polarity, and n-hexane was used to achieve the required non-polarity in the solvent system so as to attain an ideal Rf value. To remove the tailing and fronting effects of chromatography, formic acid, and glacial acetic acid were used. Amongst the multiple mobile phases tried, the combination of ethyl acetate, water, glacial acetic acid, formic acid, and n-hexane (7:1:1.1:1.1:5 v/v) was selected as an optimized solvent system. The best resolution of the Opuntiol spot was obtained with the Rf value of 0.42, Fig. 2, accomplishing the criteria of an ideal solvent system for the separation of pharmaceutical compounds and/or phytoconstituents. In order to minimize the neckless effect and ensure uniform solvent front development, the TLC chamber was previously equilibrated with the solvent system for 20 minutes prior to plate development. The solvent system was allowed to migrate up to 8 cm, which took approximately 15 minutes for the complete development.
HPTLC Method Validation: The optimized HPTLC method was used to examine several parameters, including linearity, sensitivity (in terms of LOD - Limit of Detection and LOQ - Limit of Quantification), precision, specificity, robustness, and recovery/accuracy, in accordance with ICH guidelines.
Linearity and Range: The linearity and the range of the HPTLC method were determined by plotting the calibration curve for Opuntiol at various concentrations. 1–12 μl of samples of 10μg/ml concentration were applied to the HPTLC plates so as to achieve the desired concentrations (10–120 ng/spot). The linearity curve was prepared by plotting the different concentrations (10–120 ng/spot) of the working standard solution of Opuntiol against the peak area. On the basis of Opuntiol’s linearity curve equation, the limit is selected. A 280 nm wavelength was used for each scan, Fig. 4.
Sensitivity of the Method (LOD and LOQ): LOD and LOQ were calculated based on the Where σ is the standard deviation of the response and the slope of the calibration curve. LOD = 3.3 x σ/S and LOQ = 10 x σ/S, where σ is the standard deviation of the response, and S is the slope of the calibration curve.
Precision of the Method:
Precision of Instrument: Instrument precision was assessed by plotting a working standard solution of Opuntiol 6 times (100 ng/spot) and calculating %RSD (relative standard deviation). As per ICH guidelines, the %RSD values must be <2%.
Repeatability: The method’s intraday precision was determined by analyzing 6 identical aliquots (100 ng/spot) within the day. The % RSD was <2%, indicating excellent repeatability.
Intermediate Precision: The reproducibility of the method was evaluated by analyzing sample aliquots (100 ng/spot) on three consecutive days at varied concentrations. The %RSD value was within permissible limits, suggesting the method’s reproducibility.
Robustness of the Method: The robustness of the developed analytical method was confirmed by studying the effect of small, controlled variations in solvent composition (±1), chamber saturation duration, and solvent volume. The impact of these variations on analytical results was evaluated, and the corresponding %RSD values were calculated. Values <2% suggested the robustness of the method.
Accuracy/Recovery: The accuracy of the developed method was assessed by conducting recovery trials at three levels (80, 120, and 150 ng/spot of the target concentration).
Recovery trials were conducted in triplicate. Known amounts of Opuntiol in-house working standard were added to the previously prepared ethyl acetate extract, and the recovery rates were evaluated. % recovery was calculated directly from the peak areas with the formula;
% Recovery = Peak area of the spiked sample / Peak area of the standard x 100
RESULTS AND DISCUSSION:
Method Development and Optimization: In the present investigation, a novel densitometric HPTLC method was developed and validated for the qualitative and quantitative estimation of Opuntiol isolated from the fruits of Opuntia elatior Mill. HPTLC is widely used for phytochemical analysis because of its simplicity, cost-effectiveness, minimal solvent consumption, and ability to analyze multiple samples simultaneously. The development of a reliable analytical method is essential for the standardization and quality control of herbal medicines, especially for bioactive phytoconstituents such as Opuntiol, which possess significant pharmacological activities including antioxidant, anti-inflammatory, and anticancer properties.
Mobile Phase Optimization: Optimizing the mobile phase is critical for achieving proper chromatographic resolution in HPTLC analysis. The migration behavior of an analyte depends primarily on the polarity of the solvent system and the interaction between the analyte, the stationary phase, and the mobile phase. In the present study, several solvent systems consisting of ethyl acetate, water, formic acid, glacial acetic acid, methanol, toluene, and n-hexane were investigated in various proportions to obtain optimal chromatographic separation of Opuntiol 18 -19 Supplementary Fig. 9, 10, 11, 12, 13, 14.
Initially, solvent systems composed mainly of ethyl acetate, water, formic acid, and glacial acetic acid produced relatively high Rf values (>0.75), indicating excessive polarity of the mobile phase. Such high Rf values may lead to poor separation and unreliable densitometric quantification. To overcome this limitation, n-hexane was introduced to decrease the polarity of the solvent system.
The gradual increase in the proportion of n-hexane resulted in a progressive reduction of the Rf value Table 1, Supplementary Fig. 15, 16, 17, 18, 19. Ultimately, the solvent system consisting of ethyl acetate: water: formic acid: glacial acetic acid: n-hexane (7:1:1.1:1.1:5 v/v) produced a well-resolved, compact, and symmetrical spot of Opuntiol with an Rf value of 0.42 ± 0.002, which lies within the ideal Rf range (0.2–0.8) recommended for reliable chromatographic analysis. This optimized solvent system provided excellent separation and reproducible chromatographic behavior Fig. 4.
Supplementary Figures:
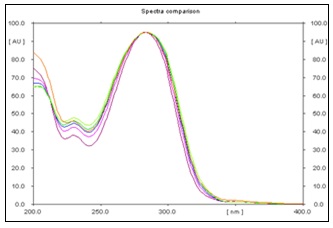
FIG. 1: DENSITOGRAM INDICATING PEAK PURITY FOR RF 0.42
TABLE 1: PEAK PURITY TABLE FOR RF 0.42
| Track | Rf | Assigned Substance | Max. Signal | Display | r(s,m) | r(m,e) | Purity |
| 1 | 0.42 | OPN | 853 AU @ 283 nm | 0.999884 | 0.999831 | 97% | |
| 2 | 0.42 | OPN | 925 AU @ 283 nm | 0.999618 | 0.999611 | 97% | |
| 3 | 0.42 | OPN | 943 AU @ 284 nm | 0.99956 | 0.999498 | 97% | |
| 4 | 0.42 | OPN | 951 AU @ 284 nm | 0.999441 | 0.999384 | 97% | |
| 5 | 0.42 | OPN | 954 AU @ 284 nm | 0.999545 | 0.999436 | 97% | |
| 6 | 0.42 | OPN | 736 AU @ 283 nm | 0.999958 | 0.999889 | 97% | |
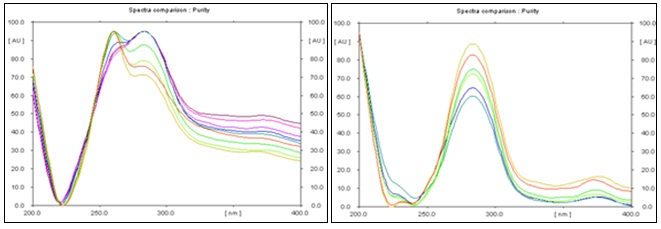
FIG. 2: DENSITOGRAM INDICATING PEAK PURITY FOR RF 0.42
TABLE 2: PEAK PURITY TABLE FOR RF 0.42
| Track | Rf | Assigned Substance | Max. Signal | Display | r(s,m) | r(m,e) | Purity |
| 1 | 0.42 | OPN | 99 AU @ 259 nm | 0.999975 | 0.999898 | 97% | |
| 2 | 0.42 | OPN | 71 AU @ 259 nm | 0.999924 | 0.999952 | 97% | |
| 3 | 0.42 | OPN | 51 AU @ 260 nm | 1 | 0.999941 | 97% | |
| 4 | 0.42 | OPN | 67 AU @ 284 nm | 1 | 0.999936 | 97% | |
| 5 | 0.42 | OPN | 84 AU @ 284 nm | 0.99997 | 0.999947 | 97% | |
| 6 | 0.42 | OPN | 46 AU @ 283 nm | 0.999983 | 0.999997 | 97% | |
Purity Assessment and Characterization Data:
FTIR:
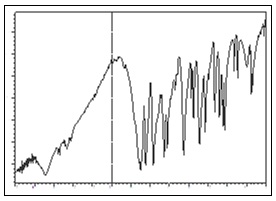
FIG. 3: FT-IR SPECTRA OF OPUNTIOL
1H and 13C NMR:
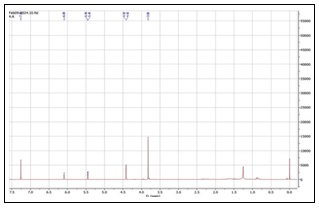
FIG. 4: 1H -NMR OF OPUNTIOL
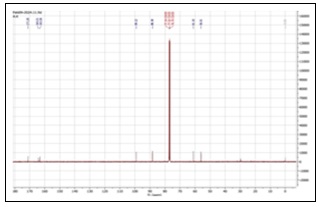
FIG. 5: 13C -NMR OF OPUNTIOL
GC-MS:
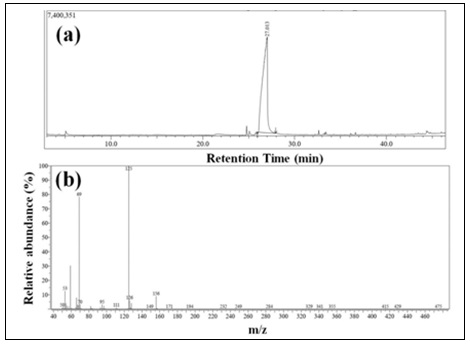
FIG. 6: (A) GC PROFILE AND (B) MASS SPECTRUM OF OPUNTIOL
SC-XRD Analysis and DSC:
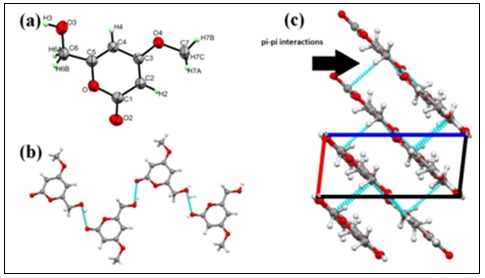
FIG. 7: (A) SCHEMATIC MOTIF OF OPUNTIOL CRYSTAL STRUCTURE (B) PLANER OPUNTIOL MOLECULES WITH INTERMOLECULAR HYDROGEN BONDING REPRESENTED BY DASHED CYAN LINE (C) Π-Π INTERACTIONS BETWEEN STACKED MOLECULES
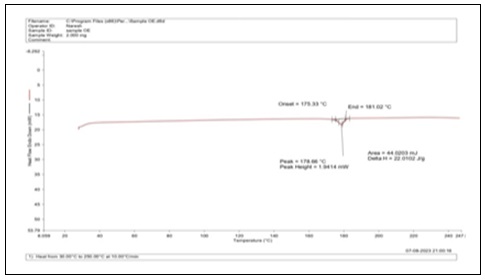
FIG. 8: DIFFERENTIAL SCANNING CALORIMETRY OF OPUNTIOL
Mobile Phase Optimization by TLC:
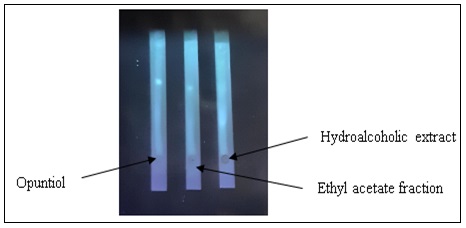
FIG. 9: TLC OF HYDROALCOHOLIC EXTRACT, ETHYL ACETATE FRACTION AND OPUNTIOL
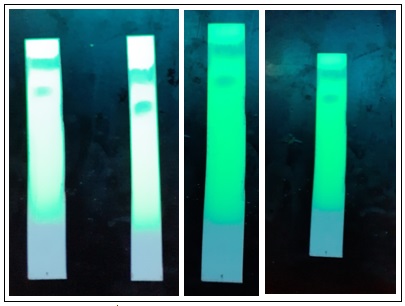
FIG. 10: TLC OF OPUNTIOL
The TLC trials were done for mobile phase optimization. The above mentioned mobile phase was tried at least 4 times for pure Opuntiol but Rf value was 0.78, 0.77, 0.78, and 0.79, Rf value calculated using the formula. Therefor there was need to optimize the mobile phase for the achievement of ideal Rf value.
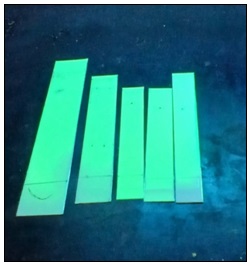
FIG. 11: TLC OF OPUNTIOL
The mobile phase used was Ethyl acetate: water: formic acid: acetic acid (100:26:11:11) which is generally used for flavonoid detection.
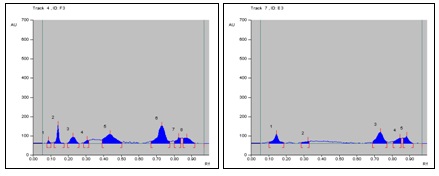
FIG. 12: HPTC CHROMATOGRAM OF ETHYL ACETATE FRACTION
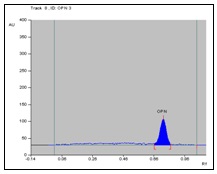
FIG. 13: HPTLC CHROMATOGRAM OF PURIFIED OPUNTIOL
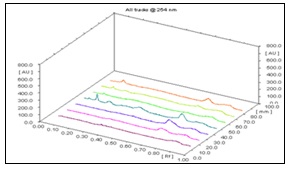
FIG. 14: DENSITOGRAM OF ALL SAMPLES ALONG WITH BLANK (1-TRACK)
From the results of TLC, HPTLC was performed for optimization of mobile phase, further the details of the HPTLC chromatogram and densitogram is provided of 120ng/spot concentration.
HPTLC Trials: Total 6 trials were performed for optimization of ideal mobile phase by using HPTLC.
Trial 1: Ethyl acetate: water: formic acid: acetic acid (10:2.6:1.1:1.1); Rf value = 0.83.
By using same mobile phase concentration single HPTLC run also carried, the photograph is given below:
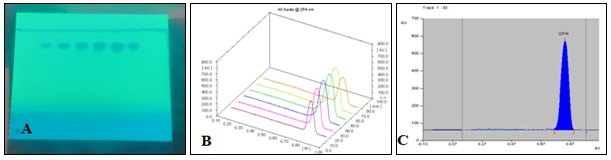
FIG. 15: A-HPTLC CHROMATOGRAM OF OPUNTIOL. (Concentration 1000 ppm) Sample application volume per track: 2.0 µl, 4.0 µl, 6.0 µl, 8.0 µl, 10.0 µl, 5.0 µl) B: HPTLC densitogram of Opuntiol, C: HPTLC chromatogram of Opuntiol
Trial 4: Ethyl acetate: water: formic acid: acetic acid: n-hexane (8:1:1.1:1.1:2); Rf value = 0.72.
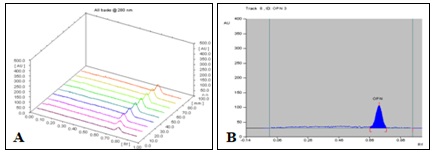
FIG. 16: A- HPTLC DENSITOGRAM OF OPUNTIOL AT 10-120 ng/ SPOTCONCENTRATION. B-HPTLC CHROMATOGRAM OF OPUNTIOL AT 120NG/SPOT CONCENTRATION
Trial 5: Ethyl acetate: water: formic acid: acetic acid: n-hexane (8:1:1.1:1.1:3); Rf value = 0.61.
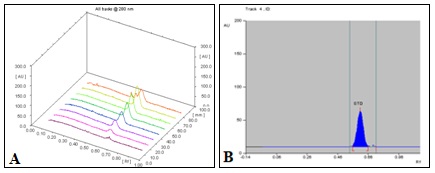
FIG. 17: A- HPTLC DENSITOGRAM OF OPUNTIOL AT 10-120 ng/SPOT CONCENTRATION. B- HPTLC CHROMATOGRAM OF OPUNTIOL AT 120ng/SPOT CONCENTRATION
Trial 6: Ethyl acetate: water: formic acid: acetic acid: n-hexane (8:1:1.1:1.1:4); Rf value = 0.56.
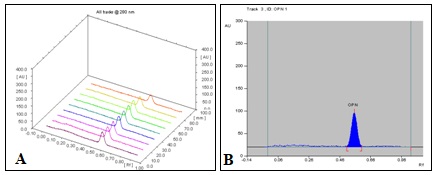
FIG. 18: A- HPTLC DENSITOGRAM OF OPUNTIOL AT CONCENTRATION 10-120 ng/SPOT. B-HPTLC CHROMATOGRAM OF OPUNTIOL AT 120 ng/SPOT CONCENTRATION
Trial 7: Ethyl acetate: water: formic acid: acetic acid: n-hexane (7:1:1.1:1.1:5); Rf value = 0.42.
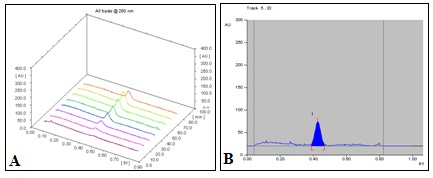
FIG. 19: A- HPTLC DENSITOGRAM OF OPUNTIOL AT CONCENTRATION 10-120 ng/SPOT. B-HPTLC CHROMATOGRAM OF OPUNTIOL AT 120 ng/SPOT CONCENTRATION
Linearity and Range: The linearity of the developed HPTLC method was evaluated over the concentration range of 10–120 ng/spot, which demonstrated a directly proportional relationship between the peak area and concentration of Opuntiol. The calibration curve exhibited a high correlation coefficient (r = 0.9956), indicating excellent linearity within the studied range. Such strong linear correlation confirms that the detector response is directly proportional to the analyte concentration, enabling accurate quantification of Opuntiol in plant extracts and pharmaceutical formulations.
The linearity range selected in the present study is suitable for the routine analysis of phytoconstituents at low concentrations in plant matrices. The results therefore demonstrate that the developed method is capable of providing reliable quantitative measurements over a wide concentration range Table 3.
TABLE 3: LINEAR REGRESSION ANALYSIS OF CALIBRATION CURVES FOR OPUNTIOL (n=3)
| Sample
(In-house standard) |
Run | Rf (mean ± SD) | Linearity range
(ng/spot) |
Regression equation | Slop
(mean ± SD) |
Intercept
(mean ± SD) |
Correlation
coefficient (r2) |
| Opuntiol | 1 | 0.425 ±
0.002 |
10-120 | y = 21.15x + 78.794 | 21.120 ±
0.116796 |
98.037 ±
18.54303 |
R² = 0.997 |
| Opuntiol | 2 | 0.425 ±
0.002 |
10-120 | y = 20.992x + 115.79 | 21.120 ±
0.116796 |
98.037 ±
18.54303 |
R² = 0.9966 |
| Opuntiol | 3 | 0.425 ±
0.002 |
10-120 | y = 21.22x + 99.529 | 21.120 ±
0.116796 |
98.037 ±
18.54303 |
R² = 0.9916 |
Sensitivity of the Method (LOD and LOQ): The sensitivity of the analytical method was assessed by calculating the limit of detection (LOD) and limit of quantification (LOQ) using the standard deviation of the response and slope of the calibration curve. The LOD and LOQ values were found to be 10.14 ± 3.04 ng/spot and 30.74 ± 9.24 ng/spot, respectively, (Table 4). These low detection limits indicate that the developed HPTLC method possesses adequate sensitivity for detecting trace quantities of Opuntiol 20-22.
TABLE 4: VALIDATION PARAMETERS: PRECISION, LOD AND LOQ (N=6)
| Parameters | Opuntiol |
| Instrument Precision (% RSD, n=6) | 0.88 |
| Repeatability/intraday (% RSD, n=6) | 1.08 |
| Intermediate precision/interday (% RSD, n=6) | 1.45 |
| LOD (ng/spot) | 10.14 ± 3.04 |
| LOQ (ng/spot) | 30.74 ± 9.24 |
The ability to detect such low concentrations is particularly important in phytochemical analysis, where marker compound concentrations may vary significantly across plant species, geographical origin, harvesting season, and extraction conditions. Therefore, the developed method can serve as a useful analytical tool for phytochemical screening and quality control studies.
Precision of the Method: Precision is an important parameter in analytical method validation because it reflects the reproducibility and reliability of the analytical procedure. In the present study, precision was evaluated in terms of instrument precision, repeatability (intra-day precision), and intermediate precision (inter-day precision). Instrument precision was determined by repeatedly applying the same concentration of Opuntiol standard solution and scanning the developed spot six times. The obtained %RSD value of 0.88% indicates excellent instrumental repeatability.
Similarly, intra-day and inter-day precision studies produced %RSD values of 1.08% and 1.45%, respectively, (Table 4). These values are well below the acceptable limit of 2% recommended by ICH guidelines, confirming the high precision and reproducibility of the developed HPTLC method. The low variability observed in precision studies indicates that the method produces consistent, reliable analytical results under normal laboratory conditions 23.
Robustness of the Method: Robustness testing was conducted to assess the analytical method's reliability under small, deliberate variations in experimental conditions. Minor changes were introduced in solvent composition, chamber saturation time, and solvent volume. The resulting %RSD values remained within the acceptable limit of ≤2%, indicating that the chromatographic performance of the method was not significantly affected by these small variations Table 5.
TABLE 5: ROBUSTNESS PARAMETERS OF THE METHOD AT 100 NG/SPOT, (N=3)
| Working standard | Parameters | Area, (Mean ± SD) | % RSD |
| Opuntiol | Composition of mobile phase EA:W:FA:GAA:H (70:10:11.1:11.1:50), EA:W:FA:GAA:H (70.5:10:11.1:11.1:45.5) | 2340.017±21.41, 2348.133±24.12 | 0.91, 1.02 |
| Opuntiol | Chamber saturation time 20 min, 25 min | 2367.85±16.68, 2291.97±33.67 | 0.70, 1.46 |
| Opuntiol | Volume of the mobile phase 15.2, 14.9 | 2351.18±14.77, 2346.97±20.11 | 0.62, 0.85 |
The robustness of an analytical method is essential for routine laboratory applications, as slight operational variations are inevitable in day-to-day analysis. The results obtained in the present study demonstrate that the developed HPTLC method is sufficiently robust and reliable for routine analysis of Opuntiol 24, 25.
Accuracy/Recovery: The accuracy of the proposed method was assessed by evaluating triplicate trials at three different concentrations: 80, 120, and 150 ng/spot. A known concentration of Opuntiol was added to the previously determined ethyl acetate extract.
The percentage mean recoveries were found to be accurate with <5% deviation, and % RSD values lie between 3-8 %, indicating the method's excellence in all the 3 runs as shown in Table 6.
TABLE 6: RECOVERY STUDY OF OPUNTIOL
| Theoretical
Concentration (ng/spot) |
Run 1 | Run 1 | Run 2 | Run 2 | Run 3 | Run 3 | |||
| Theoretical
Concentration (ng/spot) |
% Recovery | Mean % Recovery, SD | %
RSD |
% Recovery | Mean % Recovery, SD | % RSD | % Recovery | Mean % Recovery, SD | % RSD |
| 80 | 98.58 | 102.01± 3.90 | 3.82 | 87.91 | 96.51 ± 7.64 | 7.91 | 91.81 | 97.85 ± 5.27 | 5.39 |
| 120 | 106.26 | 102.01± 3.90 | 102.50 | 96.51 ± 7.64 | 101.57 | 97.85 ± 5.27 | |||
| 150 | 101.18 | 102.01± 3.90 | 99.13 | 96.51 ± 7.64 | 100.16 | 97.85 ± 5.27 |
Previous chromatographic investigations of Opuntia species have mainly focused on qualitative phytochemical profiling of crude extracts rather than the quantitative estimation of specific marker compounds. For example, Patel et al. reported HPTLC fingerprinting of alcoholic extracts of Opuntia elatior fruits using toluene:ethyl acetate:acetic acid as the mobile phase, which resulted in multiple bands corresponding to different phytoconstituents 17.
Similarly, other studies have reported HPTLC analysis for general phytochemical characterization of Opuntia extracts. In contrast, the present study focuses specifically on the development of a validated densitometric HPTLC method for the quantitative estimation of Opuntiol, a pharmacologically important flavonol. The optimized solvent system developed in this study provided a well-resolved single band corresponding to Opuntiol, enabling precise densitometric quantification.
This represents a significant improvement over previously reported qualitative fingerprinting methods. Standardization of herbal medicines requires reliable analytical methods capable of identifying and quantifying marker compounds. The validated HPTLC method developed in the present study provides a simple, cost-effective analytical tool for routine quality control of Opuntia extracts. The method can facilitate batch-to-batch consistency of herbal formulations and support the development of Opuntiol-based phytopharmaceutical products products.
CONCLUSION: The present study successfully developed and validated a rapid, sensitive, and reliable densitometric HPTLC method for the quantitative estimation of Opuntiol isolated from Opuntia elatior Mill.
The developed method demonstrated excellent linearity, precision, sensitivity, and robustness, and recovery in accordance with ICH guidelines.
ACKNOWLEDGEMENT: The authors express their deep sense of gratitude to the Rashtrasant Tukadoji Maharaj, Nagpur University, Nagpur, for funding this project under the University Research Project scheme under the grant number (RTMNU/RDC/2024/145).
Funding: The study is funded by Rashtrasant Tukadoji Maharaj Nagpur University, Nagpur, through the University Research Project scheme (Grant No. RTMNU/RDC/2024/145).
CONFLICT OF INTEREST: The authors declare no conflict of interest.
REFERENCES:
- Prajapati S and Acharya R: Opuntia elatior Mill. (Nagaphani): A review on its ethnobotany, phytochemical, and pharmacological properties. Annals of Ayurvedic Medicine 2015; 4: 107-6.
- Roome T, Aziz S, Razzak A, Aslam Z, Jamali KS, Sikandar B, Fatima T, Abidi L, Imran M, Faizi S and Shah MR: Opuntioside, opuntiol and its metallic nanoparticles attenuate adjuvant-induced arthritis: novel suppressors of toll-like receptors-2 and -4. Biomedicine & Pharmacotherapy 2019; 112: 108624. https://doi.org/10.1016/j.biopha.2019.108624.
- Siddiqui F, Naqvi S, Abidi L, Faizi S, Avesi L, Mirza T and Farooq AD: Opuntia dillenii cladode: Opuntiol and opuntioside attenuated cytokines and eicosanoids mediated inflammation. Journal of Ethnopharmacology 2016; 182: 221-34. https://doi.org/10.1016/j.jep.2016.02.016.
- Ashfaque A, Hanif F, Simjee SU, Bari MF, Faizi S, Zehra S, Mirza T, Begum S and Khan L: Opuntiol inhibits growth and induces apoptosis in human glioblastoma cells by upregulating active caspase 3 expression. Asian Pacific Journal of Cancer Prevention 2021; 22(11): 3607. https://doi.org/10.31557/APJCP.2021.22.11.3607.
- Loganayagi C, Kamal C and Sethuraman MG: Opuntiol: an active principle of Opuntia elatior as an eco-friendly inhibitor of corrosion of mild steel in acid medium. ACS Sustainable Chemistry & Engineering 2014; 2(4): 606-13. https://doi.org/10.1021/sc4003642.
- Kandan Ponniresan V, Maqbool I, Thangaiyan R, Govindasamy K and Prasad NR: Preventive effect of opuntiol, isolated from Opuntia ficus indica (L. Mill), extract against ultraviolet A radiation-induced oxidative damages in NIH/3T3 cells. International Journal of Nutrition, Pharmacology, Neurological Diseases 2019; 9(4): 156-64. https://doi.org/10.4103/ijnpnd.ijnpnd_69_19.
- Veeramani Kandan P, Dhineshkumar E, Karthikeyan R, Anbuselvan C, Maqbool I, Kanimozhi G, Arul Prakasam B and Rajendra Prasad N: Isolation and characterization of opuntiol from Opuntia ficus indica (L. Mill) and its antiproliferative effect in KB oral carcinoma cells. Natural Product Research 2021; 35(18): 3146-50. https://doi.org/10.1080/14786419.2019.1690484.
- Ganguly AK, Govindachari TR and Mohamed PA: Structure of opuntiol, a constituent of Opuntia elatior. Tetrahedron 1965; 21(1): 93-9. https://doi.org/10.1016/S0040-4020(01)82206-7.
- Kandan Ponniresan V, Balupillai A, Kanimozhi G, Khan HA, Alhomida AS and Prasad NR: Opuntiol prevents photoaging of mouse skin via blocking inflammatory responses and collagen degradation. Oxidative Medicine and Cellular Longevity 2020; 5275178. https://doi.org/10.1155/2020/5275178.
- Parys W, Dołowy M and Pyka-Pająk A: Significance of chromatographic techniques in pharmaceutical analysis. Processes 2022; 10(1): 172. https://doi.org/10.3390/pr10010172.
- Arunachalam KD, Kuruva JK, Hari S, Annamalai SK and Baskaran KV: HPTLC Finger print analysis and Phytochemical Investigation of Morinda tinctoria Roxb. Leaf extracts by HPLC and GS MS. International Journal of Pharmacy and Pharmaceutical Sciences 2015; 7(2): 360-366.
- Holčapek M, Jirásko R and Lísa M: Recent developments in liquid chromatography–mass spectrometry and related techniques. Journal of Chromatography A 2012; 1259: 3-15. https://doi.org/10.1016/j.chroma.2012.08.072.
- Al-Rubaye AF, Hameed IH and Kadhim MJ: A review: uses of gas chromatography-mass spectrometry (GC-MS) technique for analysis of bioactive natural compounds of some plants. Inter J of Toxicolo and Pharma Res 2017; 9(1): 81-85. https://doi.org/10.25258/ijtpr.v9i01.9042.
- Singh R: HPLC method development and validation: an overview. Journal of Pharmaceutical Education & Research 2013; 4(1): 26.
- Dhanapal SS, Balachandran P and Ranganathan S: Standardization and HPTLC Fingerprint Studies on the Ethanol Extracts of Vitex negundo Leaves and Opuntia dillenii Cladode. Journal of Natural Remedies 2024; 2545-51. https://doi.org/10.18311/jnr/2024/42111.
- Viloria-Matos A, Moreno-Alvarez MJ and Hidalgo-Báez D: Isolation and identification of betacyanin from fruits of Opuntia boldinghii Br. et R. by HPTLC. CYTA-Journal of Food 2001; 3(3): 140-3.
- Patel H, Prajapati S, Acharya R, CR H and Shukla V: A preliminary phyto-pharmacognostical evaluation of Opuntia elatior Mill. (Nagaphani or Hathalo-thore) fruit. International Journal of Ayurvedic Medicine 2015; 6(4): 310-6. https://doi.org/10.47552/ijam.v6i4.711.
- Sultana S, Foster K, Hossain ML, Lim LY and Locher C: Development and validation of an assay for the quantification of glycosides using high-performance thin-layer chromatography (HPTLC). Journal of Planar Chromatography–Modern TLC 2023; 36(2-3): 179-90. https://doi.org/10.1007/s00764-023-00239-y.
- Jariwala JK, Parmar GR, Ramani VD, Vaishnav DJ, Solanki NI and Shah DP: Mixture design-driven statistical optimization and method validation in HPTLC: Targeting rutin, quercetin, and gallic acid. Journal of Natural Remedies 2024; 885-96. doi:10.18311/jnr/2024/35980.
- Ojha A and Bhargava S: International Council for Harmonization (ICH) guidelines. In Regulatory affairs in the pharmaceutical industry. Academic Press 2022; 47-74. https://doi.org/10.3390/pharmaceutics17050623.
- Skoog DA, West DM, Holler FJ and Crouch SR: Fundamentals of Analytical Chemistry. Belmont: Cengage Learning, Ninth Edition 2013.
- Shrivastava A and Gupta VB: Methods for the determination of limit of detection and limit of quantitation of the analytical methods. Chronicles of Young Scientists 2011; 2(1): 21-5. 10.4103/2229-5186.79345.
- Peris‐Vicente J, Esteve‐Romero J and Carda‐Broch S: Validation of analytical methods based on chromatographic techniques: An overview. Analytical Separation Science 2015; 1757-808. 10.1002/9783527678129.assep064.
- Kumar KA, Shetty SR and Narasu L: HPTLC method development and validation for determination of rutin in flavonoid fraction of Hibiscus micranthus Linn. Journal of Chemistry 2011; 8(3): 1444-50. https://doi.org/10.1155/2011/902106.
- Patil SB, Jalalpure SS and Kunchanur MG: Validated HPTLC Method for Detection of Kaempferol in Moringa oleifera Leaf Extract and Investigation of its Antidiabetic Potential by in-vitro and in-silico Studies. Journal of Natural Remedies 2024; 1961-74. doi:10.18311/jnr/2024/36553.
How to cite this article:
Padhare SV and Khan SA: Development and validation of a densitometric HPTLC method for quantification of Opuntiol in Opuntia elatior Mill. Int J Pharm Sci & Res 2026; 17(10): 3099-12. doi: 10.13040/IJPSR.0975-8232.17(10).3099-12.
All © 2026 are reserved by International Journal of Pharmaceutical Sciences and Research. This Journal licensed under a Creative Commons Attribution-NonCommercial-ShareAlike 3.0 Unported License.
Article Information
23
3099-3112
1240 KB
5
English
IJPSR
S. V. Padhare and S. A. Khan *
Institute of Pharmaceutical Education and Research, Borgaon (Meghe), Wardha, Maharashtra, India.
shaguftakhan17@rediffmail.com
18 May 2026
08 June 2026
19 June 2026
10.13040/IJPSR.0975-8232.17(10).3099-12
01 October 2026
 Download