




DEVELOPMENT AND VALIDATION OF A SIMPLE AND NOVEL UV SPECTROPHOTOMETRIC APPROACH FOR THE QUANTITATIVE ESTIMATION OF ELLAGIC ACID IN BULK AS PER ICH GUIDELINES
HTML Full TextDEVELOPMENT AND VALIDATION OF A SIMPLE AND NOVEL UV SPECTROPHOTOMETRIC APPROACH FOR THE QUANTITATIVE ESTIMATION OF ELLAGIC ACID IN BULK AS PER ICH GUIDELINES
Gayatri Borge *, Pallavi Chouhan and Dayanand Kannur
Department of Pharmaceutical Chemistry and Quality Assurance, SCES’s Indira College of Pharmacy, Tathawade, Pune, Maharashtra, India.
ABSTRACT: Ellagic acid, a naturally occurring polyphenolic compound is found in various fruits and vegetables and has attracted considerable attention due to its broad spectrum of biological and pharmacological properties. Several key aspects of ellagic acid, including its antioxidant activity, anti-cancer properties, anti-inflammatory effects, protective role in cardiovascular health, as well as its antibacterial and antiviral activities, were highlighted in prior research. The proposed UV method, found to be simple and novel. The developed method aligns with the concept of "green" solvents, aiming to minimize the environmental damage typically caused by solvent use in chemical production. Ethanol was chosen as the solvent Instead of all other alternatives. The absorbance of ellagic acid was measured in the UV range, and a λmax of 254 nm was identified. Recovery studies and statistical validation further supported the findings of the study. The drug follows linearity in the concentration range of 2–10µg/ml. The low values of % RSD are indicative of the accuracy and reproducibility of the method. Precision was assessed through repeatability tests. Furthermore, adherence to the rigorous guidelines outlined in ICHQ2(R2) was ensured throughout the comprehensive validation process, consolidating the method's credibility and suitability for analytical applications.
Keywords: Ellagic acid, Anti-inflammatory, UV Spectroscopy, Ethanol, Validation, Method development
INTRODUCTION: Traditional medicine-based herbal remedies are frequently utilized to treat a variety of ailments. Ellagic acid (EA), a polyphenol metabolite used in herbal medicine, is present in many medicinal plants.
Ellagic acid (EA) is a polyphenol extractive (tannin) that is extracted from various fruits, nuts, and plants, including raspberries, strawberries, grapes, pomegranates, black currants, longan seeds, and green tea.
It is also known as 2,3,7,8-tetrahydroxy [1]-benzopyranol [5,4,3-cde] benzopyran-5,10-dione. Ellagitannin represent the largest group of hydrolysable tannins, with over 1000 known compounds. EA's antioxidant and anti-inflammatory qualities play a key role in protecting against natural and chemical toxicities.
Ellagic acid, with a molecular mass of 302.197 g/mol, is a highly thermostable molecule with low solubility in water and moderate solubility in alcohol. The human body can metabolize ethanol; thus, it doesn't need to be eliminated during further processing due to safety concerns. Because of its comparatively low toxicity and the fact that bioethanol, which includes all ethanol intended for food use, is produced from crops that offset carbon emissions, ethanol is referred to as a "green" solvent. Being one of the greenest organic solvents, ethanol is especially preferred for use in green spectroscopy. Ethanol is less hazardous and has a lower vapor pressure than Acetonitrile and Methanol. This results in less evaporation and, ultimately, less inhaled amounts. In addition to its antioxidative qualities and anti-inflammatory capabilities, EA has been shown to be anti-inflammatory in-vitro and in-vivo studies.
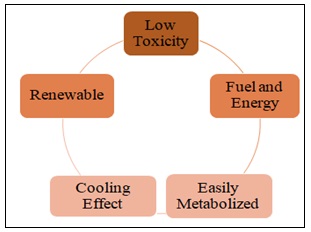
FIG. 1: BENEFITS OF ETHANOL AS GREEN SOLVENT
MATERIALS AND METHODS:
Equipment and Chemicals: Jasco v-730 spectrophotometer was used for the analysis. Labman Sonicator used for performing sonication. Ellagic acid was procured from Yucca enterprises. Ethanol was used as a solvent. For weighing and measuring of chemicals, calibrated analytical balance and glassware were used. Double distilled water was used where needed.
Preparation of Solution:
Stock A: Ellagic Acid Solution (500 ppm): Accurately weighed 5mg of Ellagic acid was transferred it into a 10ml cleaned and dried volumetric flask, and dissolved in sufficient quantity of ethanol using ultrasonicator for 10 minutes. The final volume was adjusted upto the mark with ethanol to obtain a standard stock solution of 500ppm (Stock A).
Stock B Solution (100 ppm): Two milliliters of the solution were pipetted from stock A and transferred to a 10-milliliter volumetric flask. Dilution using Ethanol was done to obtain 100 ppm solution (Stock B).
Working Standard Solutions (2-10µg/ml): A 2,4,6,8 & 10 µg/ml was prepared from Stock B. A graph was plotted between absorbance (Y-axis) and concentration (µg/ml) on the X-axis. Based on this plot, linearity was determined using the formula y = mx + c. From the calibration curve, calculate the coefficient of determination (r2), slope (m), and intercept (c).
Selection of Wavelength of Maximum Absorption: The 10µg/ml working standard solution was scanned in the 200–400 nm range. Using ethanol as a blank, the wavelength of ellagic acid was found to be 254 nm.
Calibration Curve: A series of working standard solutions as 2, 4, 6, 8, and 10 ppm were prepared using ethanol as solvent.A 1 cm quartz cuvette was used to measure absorbance at 254 nm following ethanol baseline correction. Plotting a calibration curve with concentration on the X-axis and absorbance on the Y-axis was done.
Validation Parameters: ICH Q2 (R2): The developed method was validated for following parameters: Linearity, accuracy, precision, detection limit, quantitation limit, and robustness.
Linearity: Linearity is determined by filling cuvettes with that are prepared in the range of 2–10 µg/ml of concentration, spanning at least five distinct concentrations. Ellagic Acid's regression line equation and correlation coefficient were calculated by plotting the absorbance vs. concentration calibration curve.
Accuracy: In order to determine the accuracy of the method, Ellagic Acid recoveries were calculated at three different levels: 80,100 and 120 percent of the test concentration (6 µg/ml). A mean percentage recovery was calculated and recovery values were calculated.
Detection Limit: As the name suggests, the detection limit refers to the lowest concentration of analyte that can be identified but not always quantified as an exact value.
The formula for the detection limit (LOD) = 3.3xσ/S. where σ is the relative standard deviation of the response. S stands for the calibration curve's slope (for the analyte).
Quantitation Limit: Quantitative limits are the lowest concentrations of analytes in a sample that can be quantitatively identified with appropriate precision and accuracy.
In order to calculate the Quantitation Limit (LOQ), we use the formula LOQ = 10xσ/S. where, σ is the relative standard deviation of the response. S stands for the calibration curve's slope (for the analyte).
Precision:
Repeatability: The standard solution was placed in cuvettes six times and the absorbance values of all six concentrations were measured using UV spectrophotometer. The %RSD for the area of six replicate concentrations was determined to be within the prescribed limits.
Robustness: Robustness incorporates deliberate modifications in procedure parameters and indicates the approach's reliability in typical use.
The wavelength was changed between plus and minus, and the solutions were prepared in triplicate and examined to determine the percentage of RSD.
RESULT AND DISCUSSION:
Analytical Method for Determining Drug Concentration (UV/VIS Method):
Selection of Detection Wavelength: Fig. 2 shows that Ellagic Acid has a wavelength of 254 nm.
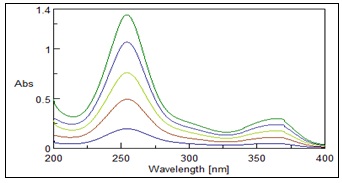
FIG. 2: OVERLAY SPECTRA OF ELLAGIC ACID
Construction of Calibration Curve: A series of working standard solutions of 2, 4, 6, 8, and 10 µg/ml was scanned at 254 nm. A graph was made showing the concentrations and their related absorbance. These concentrations showed a linear response across the investigated range of 2-10µg/ml. The calibration curve for absorbance (optical density) and concentration (ppm) was y =0.1918x+0.014, with a correlation coefficient of r2 = 0.9938 (see Fig. 3).
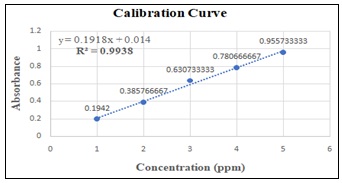
FIG. 3: CALIBRATION CURVE OF ELLAGIC ACID
Method Validation:
Linearity: Ellagic Acid's linearity was determined to be linear between 2 and 10µg/ml. As indicated in Table 1, in this study y=0.1918x+0.014 was determined as the regression equation, with r2= 0.9938 as the correlation coefficient.
TABLE 1: LINEARITY RESULT DATA
| Sr. no. | Conc. (µg/ml) | Absorbance | Std Deviation | % RSD |
| 1. | 2ppm | 0.1942 | 0.00191572 | 0.9865 |
| 2. | 4ppm | 0.38577 | 0.0059702 | 1.548 |
| 3. | 6ppm | 0.63073 | 0.00638931 | 1.013 |
| 4. | 8ppm | 0.78067 | 0.00452364 | 0.5795 |
| 5. | 10ppm | 0.95573 | 0.00115902 | 0.1213 |
Accuracy: The %Recovery was found to be in the range of 96.87-102.25% Table 2 for Ellagic Acid which indicates a good accuracy of the method.
TABLE 2: SHOWS % RECOVERY OF EA
| Level | Amount Taken (µg/ml) | Amount Spiked | Amount Found | %Recovery |
| I | 6 | 4.8 | 10.46 | 96.87% |
| II | 6 | 6.0 | 11.84 | 98.65% |
| III | 6 | 7.2 | 13.50 | 102.25% |
LOD & LOQ: The results were computed using the slope (S=0.1918) and the standard deviation of the response (σ) from six replicates of the lowest concentration (2 µg/ml).
The calibration curve is used to compute the LOD using the formula:
LOD = 3.3xσ/S,
LOQ = 10xσ/S
TABLE 3: LOD & LOQ RESULT
| Parameter | Ellagic Acid |
| LOD | 0.06869 |
| LOQ | 0.2080 |
Precision
Repeatability: Instead of utilizing six different concentrations, repeatability was evaluated using six replicate readings of the same concentration (6µg/ml). Good precision is confirmed by the low %RSD (0.366%) Table 4.
TABLE 4: REPEATABILITY RESULT
| Concentration | Absorbance |
| 6 | 0.6554 |
| 6 | 0.6586 |
| 6 | 0.6587 |
| 6 | 0.6582 |
| 6 | 0.6575 |
| 6 | 0.6526 |
| Mean | 0.65683 |
| S.D. | 0.0024 |
| %RSD | 0.36598 |
Robustness: Even with little wavelength variations, the technique remained reliable. Since wavelength variation data is the typical robustness parameter for UV methods, the previously stated inaccuracy in the "by Labman" condition has been fixed.
TABLE 5: ROBUSTNESS, ΛMAX VARIABLE CHANGED BY ±2NM
| Conc. | 252 nm | 256 nm | by Labman | ||||||
| Set I | Set II | Set III | Set I | Set II | Set III | Set I | Set II | Set III | |
| 6 | 0.6895 | 0.6944 | 0.6998 | 0.7278 | 0.7369 | 0.7476 | 0.8250 | 0.7470 | 0.8371 |
| Mean | 0.694567 | 0.73743 | 0.8030 | ||||||
| Std. Deviation | 0.005152 | 0.0091 | 0.79567 | ||||||
| %RSD | 0.741761 | 1.33611 | 0.81189 | ||||||
CONCLUSION: The UV-Visible spectroscopic method was successfully developed for the quantification of Ellagic Acid method using Ethanol as a Green solvent. Ethanol as a solvent reduces the use of hazardous solvents and is consistent with green chemistry concepts. It was discovered that the linearity range of Ellagic Acid was 2-10µg/ml.
The λmax at 254 nm provided a reliable analytical wavelength, and recovery studies further supported the accuracy of the procedure. The correlation coefficient was 0.9938, and the percentage RSD was 0.15, both of which are within acceptable bounds. Compliance with ICH Q2(R2) guidelines throughout the validation process ensures the robustness and reliability of the method for routine analytical applications. Future work should include specificity studies and application to real samples (e.g., pomegranate extract) to fully establish utility. Given its simplicity, cost-effectiveness, and minimal environmental impact, the proposed method is highly suitable for the analysis of ellagic acid in various pharmaceutical and research settings, contributing to greener and more sustainable analytical practices.
ACKNOWLEDGEMENTS: Authors are special thanks to Indira University’s, School of pharmacy providing the facilities to publish this original Research Article.
Authors Contributions: Experimental design, guidance, supervision and review work for the research was done by Dr. Dayanand Kannur, Dean, Indira Univesity School of Pharmacy and Mrs. Pallavi Chouhan, Assistant Professor, Indira University School of Pharmacy, Tathawade, Pune. Experimental work, interpretation of result and writing of this manuscript was done by Ms. Gayatri Borge, SCES’s Indira College of Pharmacy, Tathawade, Pune. All authors read and approve the final manuscript.
CONFLICT OF INTEREST: The authors declare no conflict of interest.
REFERENCES:
- Javad Sharifi-Rad: Ellagic acid: a review on its natural sources, chemical stability, and therapeutic potential. Hindawi Oxidative Medicine and Cellular Longevity 2022; 1-2.
- Ananya Bhattacharjee: A, Ellagic acid restored lead-induced nephrotoxicity by anti-inflammatory, anti-apoptotic and free radical scavenging activities 2021; 2-3.
- Evtyugin DD, Magina S and Evtuguin DV: Recent Advances in the Production and Applications of Ellagic Acid and Its Derivatives. A Review 2020; 25(12): 2745; https://doi.org/10.3390/molecules25122745.
- PengChen:L Antioxidative, anti-infammatory and anti-apoptotic efects of ellagic acid in liver and brain of rats treated by D-galactose 2019.
- Akib Nisar: Phytochemicals in the treatment of inflammation-associated diseases: the journey from preclinical trials to clinical practice. Frontiers Pharmacology 2023.
- Guideline IH: Validation of analytical procedures: text and methodology. Q2 (R1) 2005.
- Jyothi JB and Ramya K: Institute of Pharmaceutical Technology, Study Of Preformulation Characterization and UV Method Development of Ellagic Acid 2022; 1-4.
- Chen Jia-hong, Wu Dong-mei and Wang Yong-mei: Study on Quantitative Determination of Ellagic Acid by UV-spectrophotometry. Biomass Chemical Engineering 2007; 41: 18–20.
- Harsheen Kaur and Arti Thakkar: UV method development and validation of ellagic acid for its rapid quantitative estimation. Journal of Pharmaceutical Technology Research and Management 2019; 7(1): 1-5. DOI: 10.15415/jptrm.2019.71001
- Riddhi Bajpai: Development and Validation of UV Spectroscopic method for estimation of Ellagic acid in Herbal capsule used for the treatment of Diabetes 2021
- Harsheen Kaur: UV Method Development and Validation of Ellagic Acid for its Rapid Quantitative Estimation 2019.
- The green solvent: a critical perspective Neil Winterton. S. Springer Journal 2021.
- Daniely Cornélio: Anti-Inflammatory Effects of Ellagic Acid on Acute Lung Injury Induced by Acid in Mice.
- Balasubramanian I: Analytical methods for assay of ellagic acid and its solubility studies.J Pharm Biomed Anal 2006. doi: 10.1016/j.jpba.2005.07.006.
- Mateusz Pieróg: Effect of Ellagic Acid on Seizure Threshold in Two Acute Seizure Tests in Mice. Molecules 2021; 26(16): 4841. doi: 10.3390/molecules26164841
- Christian Capello: What is a green solvent? A comprehensive framework for the environmental assessment of solvents. Green Chemistry Journal 2007.
- Vallamchetty management of Type 2 Diabetes mellitus-A Randomised, Single blind, Clinical Study 2024; 341-347.
- Gopalakrishnan L, Ramana LN, Sethuraman S and Krishnan UM: Ellagic Acid Encapsulated Chitosan Nanoparticles as Anti-hemorrhagic Agent. Carbohydr Polym 2014; 111: 215–221.
How to cite this article:
Borge G, Chouhan P and Kannur D: Development and validation of a simple and novel UV spectrophotometric approach for the quantitative estimation of ellagic acid in bulk as per ICH guidelines. Int J Pharm Sci & Res 2026; 17(8): 2497-01. doi: 10.13040/IJPSR.0975-8232.17(8).2497-01.
All © 2026 are reserved by International Journal of Pharmaceutical Sciences and Research. This Journal licensed under a Creative Commons Attribution-NonCommercial-ShareAlike 3.0 Unported License.
Article Information
25
2497-2501
541 KB
369
English
IJPSR
Gayatri Borge *, Pallavi Chouhan and Dayanand Kannur
Department of Pharmaceutical Chemistry and Quality Assurance, SCES’s Indira College of Pharmacy, Tathawade, Pune, Maharashtra, India.
gayatrib14032001@gmail.com
09 April 2026
04 June 2026
23 June 2026
10.13040/IJPSR.0975-8232.17(8).2497-01
01 August 2026
 Download