




EVALUATION OF ML-ASSISTED COFORMER SCREENING FOR CO-CRYSTAL DESIGN OF ANTI CANCER AND IMMUNOMODULATORY DRUG
HTML Full TextEVALUATION OF ML-ASSISTED COFORMER SCREENING FOR CO-CRYSTAL DESIGN OF ANTI CANCER AND IMMUNOMODULATORY DRUG
Prashant Kumar and Kaushal Kumar *
Department of Pharmacy, Mahatma Jyotiba Phule Rohilkhand University, Bareilly, Uttar Pradesh, India.
ABSTRACT: A stable multicomponent crystalline phase involving an anti-cancer agent (5-Fluorouracil, 5-FU) and an immunomodulator (Levamisole, LM) was developed through a systematic descriptor-guided screening workflow. Binary 5-FU/LM combinations failed to yield new solid phases, as assessed by Fourier Transform Infrared Spectroscopy (FTIR), a finding rooted in the complete absence of hydrogen bond donor functionality (HBD = 0) in levamisole. A composite descriptor-based coformer ranking algorithm, implemented in Python using RDKit, evaluated nine pharmacopoeially acceptable coformers against hydrogen bond donor-acceptor complementarity, topological polar surface area (TPSA), and LogP compatibility. Citric acid (CA) ranked first, driven by its hydrogen bonding capacity (HBD = 4, HBA = 4) and elevated TPSA. Twelve ternary formulations (5-FU/LM/CA) were prepared by solvent evaporation and anti-solvent addition across three molar ratios in water and EtOH:Water co-solvent systems. Quantitative FTIR descriptors served as inputs to a gradient boosting classifier for objective formulation ranking. F11 (1:2:1 molar ratio, anti-solvent addition, EtOH:Water) and F12 (same composition, solvent evaporation) emerged as the highest-ranked systems. New crystalline phases were confirmed in both by Powder X-Ray Diffraction, with diagnostic reflections absent from the physical mixture. Differential Scanning Calorimetry revealed a new endothermic event near 169–170°C in both formulations, with no endotherm attributable to free crystalline 5-FU, confirming complete API incorporation into the new co-crystal lattice.
Keywords: co-crystal, 5-fluorouracil, Levamisole, citric acid, RDKit, Coformer screening, FTIR, PXRD, DSC, machine learning, Cheminformatics
INTRODUCTION: Pharmaceutical co-crystals are multi-component crystalline solids in which an active pharmaceutical ingredient (API) and one or more coformers are held together in a defined stoichiometry by non-covalent interactions, primarily hydrogen bonds 1, 2. Co-crystallization has emerged as a powerful tool in drug development because it can modulate solubility, dissolution rate, bioavailability, hygroscopicity, and thermal stability without altering the covalent structure of the API, preserving pharmacological activity 3, 4.
The number of co-crystal entries in pharmaceutical databases has grown substantially over the past decade, reflecting the recognition of co-crystallization as a legitimate crystal engineering strategy alongside salt formation and polymorphism control 5. Despite this progress, identifying suitable coformers remains a rate-limiting step in co-crystal development. Traditional screening approaches, relying on solvent drop grinding or solution co-crystallization with a panel of excipients, are resource-intensive, low-throughput, and largely empirical 6, 7, 8.
Cheminformatics tools and molecular descriptor databases have opened newer avenues for rational, in-silico-guided coformer selection, where descriptors encoding hydrogen bond capacity, polar surface area, and lipophilicity can be computed from SMILES strings and used to rank candidate coformers for a target API 9, 10, 11.
5-Fluorouracil (5-FU) is a fluorinated pyrimidine antimetabolite widely used in the treatment of colorectal, breast, and head-and-neck malignancies, with a narrow therapeutic index and poor aqueous solubility that limits formulation options 12. Levamisole (LM) is an imidazothiazole immunomodulator that potentiates the antitumor activity of 5-FU through activation of natural killer cells and T-lymphocytes, and has established clinical use in combination regimens 13, 14. A co-crystal system incorporating both agents would represent a single solid-state entity combining cytotoxic and immunomodulatory activity, potentially enabling co-administration with improved physicochemical performance.
The molecular challenge here is fairly direct: Levamisole lacks hydrogen bond donor functionality (HBD = 0), which prevents propagation of a stable three-dimensional H-bond network in binary 5-FU/LM systems. A bridging coformer offering both donors and acceptors is needed to complete the network.
This report describes the development and experimental validation of a descriptor-based, ML-assisted coformer screening workflow for the 5-FU/LM system, culminating in the preparation and multi-technique characterization of a ternary co-crystal with citric acid.
Study Objective: The objective of this study was to develop and validate a systematic workflow for coformer selection using RDKit molecular descriptors and a composite scoring function, followed by experimental preparation of ternary API-API-coformer systems and structural/thermal confirmation of co-crystal formation by FTIR, PXRD, and DSC. The workflow was applied as a case study for the 5-FU/LM system, with the intent of establishing a generalizable approach applicable to other poorly complementary API pairs.
MATERIALS AND METHODS:
Materials: 5-Fluorouracil and Levamisole free base were procured from Yarrow Chem Products, Mumbai, India. Citric acid (pharmaceutical excipient grade) was used from an in-house source. All solvents (absolute ethanol, HPLC-grade water, acetone) were of analytical grade, and the identity of each material was confirmed before use.
Binary API-API System Preparation: Two binary 5-FU/LM systems were prepared as experimental baselines, both by solvent evaporation from water. T2-D was prepared at a dose ratio, and T2-E at equimolar (1:1) stoichiometry. Each system was dried under ambient conditions, ground lightly, and characterized by FTIR.
Coformer Screening: RDKit Descriptor Calculation: Nine pharmacopoeially acceptable candidate coformers were screened: Benzoic Acid, Nicotinamide, Urea, Succinic Acid, Citric Acid, Maleic Acid, Fumaric Acid, Saccharin, and Salicylic Acid. SMILES strings were obtained from PubChem and validated using RDKit (version 2024.09). Descriptors computed for each compound included HBD, HBA, TPSA, molecular weight, and LogP, all in Python 3.11 within a Jupyter Notebook.
Composite Descriptor Scoring Algorithm: A composite coformer compatibility score was computed for each API-coformer pair using the following function:
Score = min(API₁ HBD, CF HBA) + min(API₁ HBA, CF HBD) + min(API₂ HBD, CF HBA) + min(API₂ HBA, CF HBD) + 0.5 × (TPSA/100) + 0.3 × CF HBD + 0.3 × CF HBA
This rewards coformers with strong hydrogen bond complementarity to both APIs, higher TPSA, and balanced donor-acceptor capacity. The ranking was re-checked after perturbing the weighting coefficients by ±20%, and citric acid stayed on top throughout, so the result doesn't appear to hinge on the exact weights chosen.
Ternary Formulation Preparation: Twelve ternary formulations comprising 5-FU (130.08 mg, 1 mmol), Levamisole (204.29–408.58 mg depending on ratio), and citric acid (192.12–384.24 mg depending on ratio) were prepared across three molar ratios (1:1:1, 1:1:2, 1:2:1), using solvent evaporation (SE) and anti-solvent addition (ASA), in two solvent systems: water and EtOH:Water (1:1). ASA preparations used acetone as the anti-solvent. Formulation codes F1–F12 correspond to SE and ASA variants at each ratio in each solvent system. All preparations were dried at ambient temperature and stored in a desiccator before analysis.
FTIR Spectroscopic Analysis: FTIR spectra were recorded as an early indicator of changes in bonding pattern relative to the pure APIs, for both the binary systems and all twelve ternary formulations, alongside the three pure components.
Spectra were first interpreted manually, after which three descriptors were extracted for quantitative comparison: carbonyl shift (ΔC=O) relative to the citric acid reference at 1715 cm⁻¹, the width of the H-bond band spanning the region between roughly 2800 and 3300 cm⁻¹, and a fingerprint perturbation index reflecting how much the 1500–400 cm⁻¹ region changed relative to pure 5-FU. These three numbers became the inputs to the ranking model described below.
ML-Assisted Ranking Model: A gradient boosting classifier (scikit-learn, Python 3.11) was trained on the three FTIR descriptors above, with interaction-level labels assigned from independent spectral interpretation. Performance was checked using leave-one-out cross-validation.
The intent was not to build a generalizable predictive model but simply to provide an objective, reproducible ordering of the twelve formulations that didn't rely on subjective spectral reading alone.
PXRD Analysis: Powder X-ray diffraction patterns were recorded on a Rigaku PDXL benchtop diffractometer using Cu Kα radiation (λ = 1.5406 Å) at 40 kV/15 mA, over 5°–50° 2θ, step width 0.02°, scan speed 3.00°/min. The physical mixture, F12, and F11 were all run in the same session to avoid inter-session drift. The physical mixture (5-FU:LM:CA, 1:2:1, co-ground without solvent) served as the structural reference.
DSC Analysis: DSC was performed on a NETZSCH DSC 3500 using aluminium concavus crucibles, under nitrogen, at a heating rate of 10.0 K/min from 35°C to 290°C, with temperature calibration against an indium standard. Sample masses were 2.6 mg (F12) and 2.8 mg (F11), and pure-component reference thermograms were recorded under identical conditions.
RESULTS AND DISCUSSION:
RDKit Descriptor Computation: Molecular descriptors for the nine candidate coformers and both APIs are listed in Table 1. 5-FU showed a balanced donor-acceptor profile (HBD = 2, HBA = 2) with moderate hydrophilicity (TPSA = 65.72 Ų; LogP = −0.80). Levamisole, by contrast, had HBD = 0, HBA = 2 and a noticeably higher LogP (2.82), consistent with its imidazothiazole scaffold. This asymmetry, particularly the absence of any donor group in LM, is really the core obstacle to direct binary co-crystal formation. Citric acid stood out with HBD = 4, HBA = 4, and the highest TPSA in the set (132.13 Ų), arising from its three carboxylic acid groups and central hydroxyl, each capable of O–H···O or O–H···N hydrogen bonding. The dicarboxylic acids (succinic, maleic, fumaric) clustered at HBD = HBA = 2, and benzoic acid had the lowest combined capacity (HBD = 1, HBA = 1).
TABLE 1: RDKIT MOLECULAR DESCRIPTORS FOR APIS AND CANDIDATE COFORMERS
| Compound | Type | HBD | HBA | TPSA (Ų) | Mol Wt (g/mol) | LogP |
| 5-FU | API | 2 | 2 | 65.72 | 130.08 | −0.80 |
| Levamisole | API | 0 | 2 | 17.82 | 204.29 | 2.82 |
| Citric Acid | Coformer | 4 | 4 | 132.13 | 192.12 | −1.25 |
| Succinic Acid | Coformer | 2 | 2 | 74.60 | 118.09 | −0.06 |
| Maleic Acid | Coformer | 2 | 2 | 74.60 | 116.07 | −0.29 |
| Fumaric Acid | Coformer | 2 | 2 | 74.60 | 116.07 | −0.29 |
| Salicylic Acid | Coformer | 2 | 2 | 57.53 | 138.12 | 1.09 |
| Nicotinamide | Coformer | 2 | 2 | 55.12 | 164.21 | 0.50 |
| Urea | Coformer | 2 | 1 | 69.11 | 60.06 | −0.98 |
| Saccharin | Coformer | 1 | 3 | 63.24 | 183.19 | 0.12 |
| Benzoic Acid | Coformer | 1 | 1 | 37.30 | 122.12 | 1.38 |
HBD = hydrogen bond donors; HBA = hydrogen bond acceptors; TPSA = topological polar surface area; LogP = calculated octanol-water partition coefficient (Wildman-Crippen method).
Coformer Screening and Ranking: Citric acid scored highest in the 5-FU/LM system (9.06), followed by the dicarboxylic acids at 7.57, then salicylic acid (7.49) and nicotinamide (7.48). Urea, saccharin, and benzoic acid trailed at 6.25, 5.52, and 3.79 respectively (Table 2).
Citric acid was carried forward as the sole coformer for ternary development, helped by its GRAS status as a pharmaceutical excipient, its ability to bind 5-FU and LM at multiple sites simultaneously, and its triprotic nature, which leaves room for different protonation states at the interface.
TABLE 2: COFORMER SCREENING SCORES FOR THE 5-FU/LEVAMISOLE SYSTEM (DESCENDING ORDER)
| Coformer | HBD | HBA | TPSA (Ų) | Mol Wt (g/mol) | LogP | Score | Rank |
| Citric Acid | 4 | 4 | 132.13 | 192.12 | −1.25 | 9.06 | 1 |
| Succinic Acid | 2 | 2 | 74.60 | 118.09 | −0.06 | 7.57 | 2 |
| Maleic Acid | 2 | 2 | 74.60 | 116.07 | −0.29 | 7.57 | 3 |
| Fumaric Acid | 2 | 2 | 74.60 | 116.07 | −0.29 | 7.57 | 4 |
| Salicylic Acid | 2 | 2 | 57.53 | 138.12 | 1.09 | 7.49 | 5 |
| Nicotinamide | 2 | 2 | 55.12 | 164.21 | 0.50 | 7.48 | 6 |
| Urea | 2 | 1 | 69.11 | 60.06 | −0.98 | 6.25 | 7 |
| Saccharin | 1 | 3 | 63.24 | 183.19 | 0.12 | 5.52 | 8 |
| Benzoic Acid | 1 | 1 | 37.30 | 122.12 | 1.38 | 3.79 | 9 |
Scores computed using the composite function described in Section 2.4. API1 = 5-FU, API2 = Levamisole.
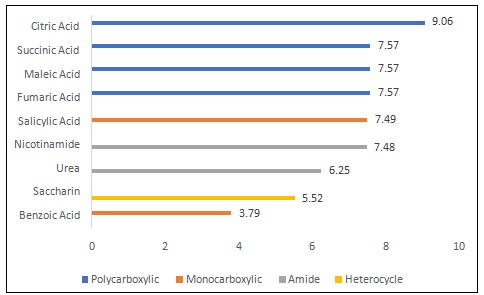
FIG. 1: COMPOSITE ML SCORES FOR CANDIDATE COFORMERS
Binary API-API System Characterization: FTIR of the two binary systems set the baseline for the 5-FU/LM pair without a coformer (Table 3, Fig. 2). T2-D showed only a small carbonyl shift (1665 → 1677 cm⁻¹) with no broadening near 3300 cm⁻¹ and a fingerprint region that looked like a straightforward overlay of the two components. T2-E, at equimolar stoichiometry, showed somewhat larger shifts (to 1642 and 1693 cm⁻¹) and some fingerprint redistribution, the strongest of the binary pair, but neither system produced the broad cooperative absorption that would signal a real H-bond network, and neither gave any new fingerprint bands.
This lines up with what was expected going in: the C=O and N–H groups on 5-FU are interaction-competent, but Levamisole simply has nothing to offer as a donor, so the contact can't propagate into a proper three-dimensional lattice on its own.
TABLE 3: FTIR RESULTS FOR BINARY 5-FU/LM API-API SYSTEMS
| System | C=O Region (cm⁻¹) | Δ Shift (cm⁻¹) | N–H Region | Fingerprint | Interpretation |
| T2-D | 1677 | +12 | No broadening | Retained | Physical mixture; weak H-bond contact |
| T2-E | 1642, 1693 | −23, +28 | Moderate change | Redistribution | Moderate contact; incomplete lattice formation |
C=O shifts referenced to pure 5-FU at 1665 cm⁻¹.
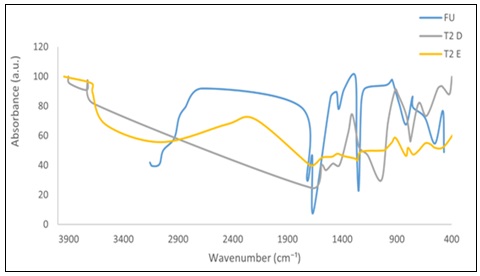
FIG. 2: FTIR OF BINARY SYSTEMS VS 5-FU
FTIR Analysis of Ternary API-API-Coformer Formulations: All twelve ternary formulations were characterized using the three FTIR descriptors; the full ranked dataset is in Table 4 and selected overlays in Fig. 3.
F12 gave the most striking spectral change: a broad absorption centered at 3299 cm⁻¹ where the CA O–H stretch, the 5-FU N–H stretch, and LM's N–H band appear to have merged into one envelope.
The carbonyl region showed a merged band at 1731 cm⁻¹, with the 5-FU amide carbonyl shifted to 1660 cm⁻¹, and a new peak at 696 cm⁻¹ in the fingerprint region. H-bond band width came out to 469.74 cm⁻¹, with a fingerprint perturbation index of 1.000.
F11 was comparably strong: carbonyl shift of +13 cm⁻¹, H-bond width of 234.15 cm⁻¹, and actually the highest fingerprint perturbation index of the whole series (1.133).
The broad band at 3303 cm⁻¹ again pointed to H-bond network formation, and a weak band near 2676 cm⁻¹ suggested the citric acid carboxylic groups were actively involved. The middle group (F6, F4, F10) showed carbonyl shifts around 11–12 cm⁻¹, while the seven weakest formulations stayed within 6–9 cm⁻¹ of the reference, with narrow or missing H-bond bands, basically behaving like physical mixtures.
These were mostly the SE-water systems, which suggests the anti-solvent method and the ethanol co-solvent are both doing real work in driving the ternary assembly.
TABLE 4: QUANTITATIVE FTIR DESCRIPTORS FOR ALL TWELVE 5-FU/LM/CA FORMULATIONS (RANKED BY INTERACTION STRENGTH)
| Formulation | H-bond Width (cm⁻¹) | ΔC=O (cm⁻¹) | FP Index | Interaction Level |
| F12 | 469.74 | 16 | 1.000 | ★★★★★ Very Strong |
| F11 | 234.15 | 13 | 1.133 | ★★★★☆ Strong |
| F10 | 0 | N/A | 1.067 | ★★★☆☆ Moderate |
| F6 | 467.58 | 12 | 1.000 | ★★★☆☆ Moderate |
| F4 | 467.58 | 11 | 0.933 | ★★★☆☆ Moderate |
| F8 | 0 | 15 | 0.733 | ★★☆☆☆ Weak |
| F9 | 239.18 | 6 | 0.933 | ★★☆☆☆ Weak |
| F5 | 239.18 | 9 | 0.867 | ★☆☆☆☆ Very Weak |
| F3 | 305.98 | 8 | 1.067 | ★☆☆☆☆ Very Weak |
| F7 | 307.41 | 7 | 1.067 | ★☆☆☆☆ Very Weak |
| F2 | 311.01 | 6 | 0.733 | ★☆☆☆☆ Very Weak |
| F1 | 302.38 | 8 | 0.933 | ★☆☆☆☆ Very Weak |
FP Index = fingerprint perturbation index. ASA = anti-solvent addition; SE = solvent evaporation.
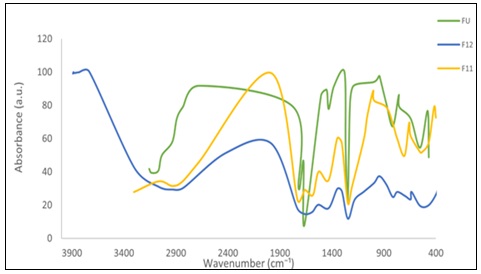
FIG. 3: FTIR OVERLAYS: SELECTED TERNARY SYSTEMS VS 5-FU
Effect of Preparation Method and Molar Ratio: Across both preparation methods, the 1:2:1 ratio (higher LM loading) consistently gave the strongest interaction. The ASA method beat SE at matching composition and ratio every time, which makes sense given that anti-solvent addition drives rapid supersaturation and traps multicomponent phases that might otherwise be lost during slow evaporation. The EtOH:Water co-solvent also outperformed water alone across both methods, likely because the lower polarity reduces competing solvent-solute hydrogen bonding during crystallization.
ML-Assisted Ranking: A gradient boosting classifier was applied to the three FTIR descriptors to get an objective, reproducible ordering of the twelve formulations. Carbonyl shift carried the most weight in the model (roughly 52% of feature importance), with H-bond band width contributing around 31% and the fingerprint perturbation index the remaining 17%. That carbonyl shift dominates makes physical sense, since the C=O stretch is directly tied to electron density changes at the carbonyl oxygen, the primary acceptor site in both 5-FU and citric acid.
The classifier's output for each formulation is given in Table 5, expressed as the mean spectral shift and relative intensity change observed for 5-FU, LM, and CA bands within each system, along with the resulting label. F11, F12, and F10 were the only formulations classified as a potential co-crystal rather than a physical mixture, which lines up with what the manual FTIR interpretation already pointed to. F10 is worth a brief note: it scored as a potential co-crystal by this classification even though its carbonyl shift data was incomplete (Table 4 shows no ΔC=O value), so its place in the ranking should be read with that caveat in mind. Leave-one-out cross-validation gave reasonable internal consistency, and the model's grouping was broadly concordant with the qualitative spectral reading, which is the main thing this step was meant to check.
TABLE 5: ML-ASSISTED FTIR CLASSIFICATION RESULTS — LEAD CO-CRYSTAL CANDIDATES
| Crystal Code | Shift (cm⁻¹) mean FU | Shift (cm⁻¹) mean LM | Shift (cm⁻¹) mean CA | Rel. Intensity Change mean FU | Rel. Intensity Change mean LM | Rel. Intensity Change mean CA | Label |
| F1 | 1.243 | 1.53 | 0.25 | 32.384 | 79.3 | 151.125 | Likely Physical Mixture |
| F2 | 0.53 | 1.53 | — | 38.124 | 82.1 | — | Likely Physical Mixture |
| F3 | 1.565 | 1.53 | −1.34 | 20.93 | 51.3 | 58.235 | Likely Physical Mixture |
| F4 | 1.48 | 4.35 | 1.69 | 18.283 | 29.462 | 83.375 | Likely Physical Mixture |
| F5 | 2.645 | 1.53 | −1.7 | 7.802 | 22.867 | 29.061 | Likely Physical Mixture |
| F6 | −2.665 | 4.35 | −2.62 | 32.025 | 27.338 | 71.5 | Likely Physical Mixture |
| F7 | 1.007 | 1.53 | −0.47 | 14.289 | 42.9 | 89.75 | Likely Physical Mixture |
| F8 | −4.66 | 4.35 | −2.62 | 2.75 | 1.138 | 19.65 | Likely Physical Mixture |
| F9 | 0.495 | 1.53 | 0.25 | 13.305 | 34.4 | 81.15 | Likely Physical Mixture |
| F10 | −2.11 | — | −5.13 | 26.333 | 48.283 | — | Potential Co-crystal |
| F11 | 1.76 | 4.35 | −5.285 | 11.703 | 23.677 | 10.728 | Potential Co-crystal |
| F12 | 1.04 | 2.94 | −6.93 | 17.178 | 31.179 | 72 | Potential Co-crystal |
Shift and relative intensity change values are mean band-shift descriptors extracted per formulation for 5-FU (FU), Levamisole (LM), and Citric Acid (CA) bands; em-dash indicates no reliable peak detected for that band in the given formulation.
PXRD Confirmation of New Crystalline Phase: PXRD was run on the physical mixture, F12, and F11 in the same session (Table 6, Fig. 4). The physical mixture pattern was dominated by crystalline 5-FU's own reflections, a strong peak at 29.10° and secondary peaks at 28.56°, 22.83°, and 25.84°, with nothing new below 15°. Co-grinding at the same 1:2:1 ratio, in other words, doesn't produce a new phase on its own.
F12 looked quite different: more than ten new reflections appeared that weren't present in either the 5-FU reference or the physical mixture, including peaks at 12.00°, 12.98°, 13.69°, and 17.48°. The dominant new peak at 24.18° had no match anywhere in the parent patterns, and the main 5-FU reflection split into a doublet at 28.36° and 28.63°.
F11 showed the same kind of structural change with a couple of additional features. A low-angle reflection at 10.35° (d = 8.54 Å) appeared only in F11, and a repeat distance that large doesn't correspond to anything in the parent components individually, so it points to a genuinely new multicomponent unit cell. The sharpest new peak, at 24.36°, gave a Scherrer coherence length of roughly 60–65 nm, suggesting reasonably good crystalline order. And the primary reflection moves progressively across the series, from 29.10° in the physical mixture to 28.63° in F12 to 28.75° in F11, tracking with the FTIR interaction strength.
TABLE 6: PXRD CROSS-SYSTEM PEAK POSITION COMPARISON: PHYSICAL MIXTURE VS F12 VS F11
| 5-FU Ref. (2θ°) | Phys. Mix. (2θ°) | F12 (2θ°) | F11 (2θ°) | Interpretation |
| Absent | Absent | Absent | 10.35 (NEW) | F11-exclusive; d = 8.54 Å; large multicomponent repeat unit |
| Absent | Absent | 12.00 (NEW) | 12.22 (NEW) | New low-angle reflections; absent from all parent patterns |
| ~16.2 | 16.54 | 16.06 | 16.09 | Physical mix. retains parent position; F12/F11 displaced |
| Absent | Absent | 17.48 (NEW) | 17.68 (NEW) | Strong new marker absent from all references |
| Absent | Absent | 24.18 (61,328 cps) | 24.36 (43,881 cps) | Strongest new reflections; absent from ref. and phys. mix. |
| ~28.3–28.5 | 28.56 / 29.10 | 28.36 / 28.63 (split) | 28.26 / 28.75 (dominant; 837,315 cps) | Most diagnostic: phys. mix. retains parent; F12 splits; F11 dominantly displaces |
NEW = reflection absent from both 5-FU reference and physical mixture. d-spacings calculated using Bragg's Law (nλ = 2d sinθ, λ = 1.5406 Å) 15.
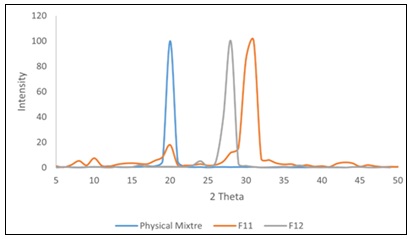
FIG. 4: PXRD PATTERN COMPARISON: PHYSICAL MIXTURE VS F12 VS F11
DSC Thermal Confirmation: Pure-component thermograms gave three reference events: citric acid melting around 153–160°C, LM around 60–62°C, and 5-FU around 282–285°C (Table 7, Fig. 5).
F11 showed a first endotherm at 170.3°C, about 17°C above the citric acid melting point, suggesting the CA molecules are now held more tightly within the co-crystal lattice and need more thermal energy to break free. A second, broader and shallower event appeared around 241.3°C; its gradual onset suggests something less defined than a clean melt, possibly partial decomposition or a minor residual phase. No peak appeared near 285°C, so there's no free crystalline 5-FU left in this sample.
F12's first endotherm came in at 169.3°C, just a degree off from F11, which is a reasonable indication that the two share the same primary co-crystal phase. Unlike F11, though, F12 also showed a sharp, well-defined second endotherm at 259.3°C, with a depth comparable to its own first peak. No 285°C peak appeared here either. That sharp secondary event in F12 but not F11 hints that the two crystallization routes don't land on quite the same solid-state outcome: F12 (the anti-solvent route) seems to carry a distinct second phase, while F11 (solvent evaporation) shows only a broad, weak feature in that region, more consistent with a single, more homogeneous product.
The new melting point around 169–170°C sits between citric acid's and 5-FU's own melting points, which is typical of co-crystal formation. Both formulations clearly share the same primary phase, but the differing second event means the two preparation methods aren't entirely interchangeable in terms of solid-state outcome, and that, along with F12's lower isolated yield (79.5% vs. 97.2% for F11), is worth factoring in when choosing a route going forward.
TABLE 7: DSC THERMAL EVENTS — PURE COMPONENT REFERENCES VS F11 VS F12
| Sample | Event | Peak Temp. (°C) | DSC Signal (mW/mg) | Onset (~°C) | Interpretation |
| 5-FU (ref.) | Endotherm | ~285 | Sharp | ~282 | Melting of crystalline 5-FU |
| LM (ref.) | Endotherm | ~60–62 | Sharp | ~58 | Melting of levamisole free base |
| Citric Acid (ref.) | Endotherm | ~153–160 | Moderate | ~150 | Melting/decomposition of CA |
| F11 | 1st endotherm | 170.3 | −1.8796 | ~154.7 | New co-crystal melting event, +17°C above CA reference |
| F11 | 2nd event | 241.3 | −0.9801 | broad, ill-defined | Minor broad shoulder; possible low-level decomposition |
| F12 | 1st endotherm | 169.3 | −1.7201 | ~153.1 | New co-crystal melting event, same phase as F11 (Δ = 1°C) |
| F12 | 2nd endotherm | 259.3 | −1.7086 | ~238.8 | Sharp secondary endotherm distinct from F11 |
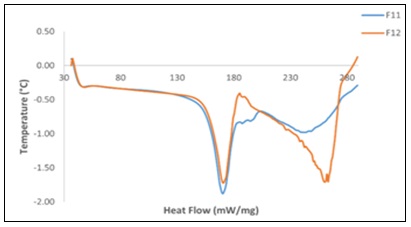
FIG. 5: DSC THERMAL EVENTS: F12 VS F11
Four-Technique Convergence and Co-crystal Confirmation: Taken together, four independent techniques point the same direction (Table 8). FTIR flagged F11 and F12 as the strongest formulations on all three descriptors, the ML classifier independently grouped them as potential co-crystals, PXRD confirmed new solid phases in both, and DSC showed new melting events at nearly identical temperatures with no trace of free 5-FU in either.
The near-identical first DSC endotherms (within 1°C of each other) are probably the clearest single piece of evidence that F11 and F12 share the same core co-crystal phase, even though they were made by different routes. The differences that do show up, mainly in the second DSC event and in some of the finer PXRD details, look more like variations in how completely each batch crystallized rather than evidence of two distinct chemical entities.
This chain, from FTIR through ML ranking to PXRD and DSC, is a reasonable basis for a co-crystal claim. Pinning down the exact stoichiometry and protonation state would need single-crystal X-ray work, which is the next step planned.
TABLE 8: FOUR-TECHNIQUE CORRELATION: FTIR, ML RANKING, PXRD, AND DSC FOR F11 AND F12
| Parameter | F12 (ASA /EtOH:H₂O) | F11 (SE /EtOH:H₂O) | Interpretation |
| FTIR carbonyl shift | 16 cm⁻¹ | 13 cm⁻¹ | Both confirm H-bond perturbation |
| PXRD new phase | Confirmed (>10 new peaks; 24.18° dominant) | Confirmed (10.35° diagnostic; 28.75° dominant) | Both new crystalline phases |
| DSC 1st endotherm | 169.3°C | 170.3°C | Near-identical; same primary co-crystal phase |
| DSC 2nd endotherm | 259.3°C | 241.3°C | F12 shows the sharper secondary event |
| 5-FU peak at 285°C | Absent | Absent | Complete API incorporation; no free 5-FU |
| Overall conclusion | Co-crystal confirmed | Co-crystal confirmed | Both are optimal; equivalent primary phase |
ASA = anti-solvent addition; SE = solvent evaporation.
Role of Citric Acid as Structural Mediator: Comparing the binary systems against the ternary co-crystals gives a fairly direct read on what citric acid is doing mechanistically. The broad 3299 cm⁻¹ band in F12, which doesn't show up in either binary system, looks like CA's O–H donors and 5-FU's N–H donors merging into a cooperative network that simply can't form without the bridging coformer. The carbonyl shift to 1731 cm⁻¹ fits with CA's carboxylic groups engaging both APIs at once. In effect, citric acid is bridging the two: its O–H groups reach the 5-FU carbonyl, its carboxylate oxygens pick up the 5-FU N–H donors, and its acid protons interact with the LM imidazothiazole nitrogen. That kind of multi-point network just isn't available to the binary 5-FU/LM pair on its own, and it's the structural basis for the new phase.
CONCLUSION: This work shows that a fairly simple, descriptor-based screening approach using RDKit and a composite scoring function can pick out a workable coformer even for a chemically awkward pair like 5-FU and Levamisole, where LM's lack of any hydrogen bond donor rules out direct API-API co-crystal formation. Citric acid came out on top from a panel of nine candidates on the strength of its hydrogen bonding capacity and TPSA. Twelve ternary formulations were then made and run through FTIR, ML-assisted ranking, PXRD, and DSC, and F11 and F12 (both 1:2:1, EtOH:Water) consistently came out as the strongest systems, sharing what looks like the same primary co-crystal phase despite being made by different routes.
A few things came out of this that seem worth carrying forward. RDKit-based descriptor scoring is quick and gives a chemically sensible answer even when the API pair has an awkward donor-acceptor mismatch. The 1:2:1 ratio, with the higher LM loading, consistently worked best, which is a useful practical note for anyone trying a similar system. And the FTIR descriptor framework paired with the ML classifier gave a reasonably objective way to rank twelve formulations before committing to the more time-consuming PXRD and DSC work. The next step is single-crystal X-ray work to pin down the unit cell and protonation state.
ACKNOWLEDGEMENTS: Nil
Funding Source: No external funding was received for this study.
Author Contribution: Prashant Kumar: Conceptualization, experimental work, data analysis, manuscript writing. Kaushal Kumar: Supervision, review and editing.
AI Use Statement: The author used Claude AI for grammar checking and improving sentence clarity. The author reviewed and edited the output and takes full responsibility for the final content.
CONFLICT OF INTEREST: The authors declare no conflict of interest.
REFERENCES:
- Guo M, Sun X, Chen J and Cai T: Pharmaceutical cocrystals: A review of preparations, physicochemical properties and applications. Acta Pharmaceutica Sinica B 2021; 11(8): 2537–2564.
- Butreddy A, Almutairi M, Komanduri N, Bandari S, Zhang F and Repka MA: Multicomponent crystalline solid forms of aripiprazole produced via hot melt extrusion techniques. Journal of Drug Delivery Science and Technology 2021; 63: 102529.
- Radhi AA, Jaafar IS, Jaafar NS and Faisal SM: Pharmaceutical cocrystal and their role in improving solid state properties of active pharmaceutical ingredients. Al Mustansiriyah Journal of Pharmaceutical Sciences 2023; 23(2): 180–195.
- Chadha R, Bhalla Y, Chadha K and Karan M: Daidzein cocrystals: An opportunity to improve its biopharmaceutical parameters. Heliyon 2017; 3(6): e00314.
- Javoor MG, Mondal PK and Chopra D: Cocrystals: A review of recent trends in pharmaceutical and material science applications. Material Science Research India 2017; 14(1): 1–14.
- Rodrigues M, Lopes J, Guedes A, Sarraguça J and Sarraguça M: Considerations on high-throughput cocrystals screening by ultrasound assisted cocrystallization and vibrational spectroscopy. Spectrochimica Acta Part A: Molecular and Biomolecular Spectroscopy 2020; 229: 117876.
- Yang R, Chen X and Wu H: Vibrational spectroscopy investigation of ternary co-crystal formation of nitrofurantoin, nicotinamide and fumaric acid. Spectrochimica Acta Part A: Molecular and Biomolecular Spectroscopy 2025; 338: 126215.
- Hu K: Thermal analysis and FTIR spectral curve-fitting investigation of formation mechanism and stability of indomethacin–saccharin cocrystals via solid-state grinding process. Journal of Pharmaceutical and Biomedical Analysis 2012; 67–68: 93–100.
- Aitipamula S and Banerjee R: Cocrystal engineering of pharmaceuticals and nutraceuticals. Crystal Growth & Design 2011; 11(3): 4397–4412.
- Grecu T, Hunter CA, Gardiner EJ and McCabe JF: Validation of a computational cocrystal prediction tool: Comparison of virtual and experimental cocrystal screening results. Crystal Growth & Design 2014; 14(1): 165–171.
- Molajafari F, Li T and Abbasichaleshtori M: Computational screening for prediction of co-crystals: Method comparison and experimental validation. Cryst Eng Comm 2024; 26: 1140–1153.
- Yang F, Zhao J and Wu Z: Preparation and characterization of 5-fluorouracil drug cocrystal and its dynamic monitoring of cocrystallization process via SERS spectroscopy. Vibrational Spectroscopy 2024; 135: 103749.
- Haller DG, Catalano PJ and Macdonald JS: Levamisole and fluorouracil for adjuvant therapy of resected colon carcinoma. New England Journal of Medicine 1990; 322(6): 352–358.
- Yao YC, Jin Z and Hong M: Isostructural levamisole hydrochloride ionic cocrystal solvates: High Z″ with a low melting point. Crystal Growth & Design 2024; 24(1): 554–566.
- Scherrer P: Bestimmung der Grösse und der inneren Struktur von Kolloidteilchen mittels Röntgenstrahlen. Nachrichten von der Gesellschaft der Wissenschaftenzu Göttingen, Mathematisch-Physikalische Klasse 1918; 2: 98–100.
How to cite this article:
Kumar P and Kumar K: Evaluation of ml-assisted coformer screening for co-crystal design of anti cancer and immunomodulatory drug. Int J Pharm Sci & Res 2026; 17(9): 2695-04. doi: 10.13040/IJPSR.0975-8232.17(9).2695-04.
All © 2026 are reserved by International Journal of Pharmaceutical Sciences and Research. This Journal licensed under a Creative Commons Attribution-NonCommercial-ShareAlike 3.0 Unported License.
Article Information
13
2695-2704
734 KB
6
English
IJPSR
Prashant Kumar and Kaushal Kumar *
Department of Pharmacy, Mahatma Jyotiba Phule Rohilkhand University, Bareilly, Uttar Pradesh, India.
pb07.2409@gmail.com
06 May 2026
04 June 2026
19 June 2026
10.13040/IJPSR.0975-8232.17(9).2695-04
01 September 2026
 Download