




FORMULATION, DEVELOPMENT AND EVALUATION OF FEBUXOSTAT LOADED FAST MOUTH DISSOLVING STRIP FOR THE TREATMENT OF GOUT
HTML Full TextFORMULATION, DEVELOPMENT AND EVALUATION OF FEBUXOSTAT LOADED FAST MOUTH DISSOLVING STRIP FOR THE TREATMENT OF GOUT
Dhanashree Raval, Archana Magdum *, Disha Magdum, Rajashree Mane, Manasvi Narsule, Sayali Patil, Pratima Shinde and Karuna Badade
Sant Gajanan Maharaj College of Pharmacy, Mahagaon, Chinchewadi, Maharashtra, India.
ABSTRACT: This study’s objective is to formulate and develop a fast mouth dissolving strip which will contains a febuxostat as an API against gout disease. This strip is made by utilizing solvent casting method. To the manufacturing of febuxostat fast mouth dissolving strip, a two-factor (23) factorial design was used. The independent factors for the fast mouth dissolving strip were percentage of HPMC and PEG 400, whereas dependent variables were percentage of cumulative drug release and disintegration time. Febuxostat fast mouth dissolving strip was evaluated through organoleptic properties, thickness, moisture content and moisture uptake, drug content uniformity, weight uniformity, tensile strength, disintegration test, folding endurance, surface pH, swelling index, in-vitro drug release. In-vivo bioavailability study, stability study performed on the optimized batch B6. Disintegration time for optimized batch found that 15 seconds. The strips were white in color and plane in texture. The thickness of optimized batch found that 0.24 mm, the drug content uniformity was 87.99 % of optimized batch which was calculated by dissolving strip for number of hours. A reduction in first pass metabolism that increases in absorption into the systemic circulation, maximum drug release of optimized batch is 67.96 % obtained by calculating absorbance which were got from in-vitro dissolution study. The stability formulation was tested under accelerated temperature and humidified condition, at second month of stability test drug content was found that 72.85 ± 4.59, disintegration time17.2 ± 0.964 and surface pH6.39 ± 0.01. Febuxostat fast mouth dissolving strips were successfully formulated by the solvent-casting method.
Keywords: Fast mouth dissolving strip, Febuxostat, Drug release, In-vivo dissolution study, In-vivo bioavailability study
INTRODUCTION: Gout is a chronic inflammatory metabolic disorder characterized by the deposition of monosodium urate (MSU) crystals in joints and surrounding tissues due to elevated serum uric acid levels (hyperuricemia). The disease commonly affects the toes, knees, ankles, and fingers, causing recurrent episodes of severe pain, swelling, redness, and inflammation.
Persistent hyperuricemia results from either excessive uric acid production or impaired renal excretion and is considered the primary risk factor for gout development. Other contributing factors include genetic predisposition, dietary habits, alcohol consumption, obesity, and renal dysfunction 1-3.
Effective management of gout requires long-term reduction of serum uric acid levels to prevent crystal deposition and disease progression. Febuxostat is a non-purine selective xanthine oxidase inhibitor widely used for the treatment of chronic hyperuricemia associated with gout. It reduces uric acid production by inhibiting both the oxidized and reduced forms of xanthine oxidase, thereby preventing the conversion of hypoxanthine and xanthine into uric acid. Compared with allopurinol, febuxostat exhibits greater selectivity toward xanthine oxidase and can be used in patients with mild to moderate renal impairment 4-6. However, conventional oral tablet formulations may be associated with delayed onset of action, variable gastrointestinal absorption, and patient compliance issues, particularly among geriatric patients and individuals experiencing swallowing difficulties. Fast mouth dissolving strips (FMDS) have emerged as a promising oral drug delivery system because they rapidly disintegrate upon contact with saliva, releasing the drug without the need for water. These thin polymeric films offer several advantages, including ease of administration, improved patient compliance, rapid drug release, and the potential to enhance bioavailability through pre-gastric absorption. The oral mucosa possesses a rich vascular network that facilitates rapid absorption and may partially bypass hepatic first-pass metabolism, thereby improving systemic drug availability. Among the various manufacturing techniques available, the solvent-casting method is widely employed due to its simplicity, cost-effectiveness, and ability to produce uniform films with desirable mechanical properties 6-10. Considering the therapeutic importance of febuxostat and the advantages of fast dissolving oral films, the present study aimed to formulate and optimize febuxostat-loaded fast mouth dissolving strips using the solvent-casting method. A factorial design approach was employed to evaluate the influence of hydroxypropyl methylcellulose (HPMC E5 LV) and polyethylene glycol 400 (PEG 400) on drug release and disintegration characteristics. The novelty of the present work lies in the development and optimization of a febuxostat fast mouth dissolving strip intended to improve patient convenience, provide rapid drug release, and enhance oral bioavailability for the effective management of gout 11-14.
MATERIALS AND METHODS:
Materials: Analytically pure sample of febuxostat with purity greater than 99% was purchased from Dhamtec Pharma and Consultants Navi Mumbai, India. HPMC E5 LV, PEG 400, mannitol, peppermint oil, ethanol was obtained from Unichem Kolhapur, Maharashtra. All other chemical and solvent utilized was analytical grade.
Methodology Experimental Design: Two factor, three-level (32) factorial design for Febuxostat fast mouth dissolving strip was used to optimize the formulation. Each of the 2 factors was evaluated at 3 distinct level (low, middle, high) and experimental tests were conducted with each of the nine possible combinations. For the buccal patch, the percentages of cumulative drug release (Y1), disintegration time (Y2) were selected to serve as dependent variables, while percentages polymer concentration (X1) and plasticizer concentration (X2) were chosen the independent factor. The fast mouth dissolving strip was made using the same quantity of Febuxostat (10 mg) in each of the nine batches. The method 32 factorial design for development of Febuxostat strip’s dependent and independent variables are shown as follows 15.
TABLE 1: EXPERIMENTAL DESIGN
| Factor | Level used | ||
| Low (-1) | Medium (0) | High (+1) | |
| A) Independent Variables | |||
| X1: - Polymer (HPMC) mg | 400 | 525 | 650 |
| X2: - Plasticizer (PEG 400) mg | 100 | 125 | 150 |
| B) Dependent Variables | |||
| Y1: - Cumulative Drug release %% | Maximize | ||
| Y2:- disintegration (sec) | Minimize | ||
Preparation of Febuxostat fast Mouth Dissolving Strips by Solvent-casting Method: Solvent casting process used to manufacture Febuxostat fast mouth dissolving strips by using water and ethanol as a solvent. Orally disintegrating strips (ODS) are made using a multi-step solvent casting technique (Solvent selection). An appropriate organic solvent is used to dissolve additional solvent-soluble excipients. Excipients are dissolved in water and ethanol in 4:1 proportion. HPMC E 5 LV, PEG 400 (polymer, plasticizer) dissolved in water and mannitol is dissolved in water and after that drug is dissolved in ethanol and injected to a mixture of polymer (Active substance Addition). After that, the Medication Febuxostat 10 mg is mixed in mixture. Stirring the solution vigorously to assure sufficient blending and the creation of a uniform solutions (Mixing). After that, the homogenized mixture (where the drug was distributed uniformly) is placed into a suitable mold. Pouring solution into the dish and spreading it uniformly to obtain a consistent thickness is the casting process (Casting). They let the cast solution dry at room temperature for 48 hrs. Each strip contains 10mg of Febuxostat. Each strip having dimension of 2 -2 cm. A hardened strip is left behind as the solvent evaporate during the drying process (Drying). After drying strips were stored under dark area and away from sunlight explosure 16.
TABLE 2: FORMULATION COMPOSITION OF ALL FORMULATIONS
| Ingredients | B1 | B2 | B3 | B4 | B5 | B6 | B7 | B8 | B9 |
| Febuxostat (mg) | 10 | 10 | 10 | 10 | 10 | 10 | 10 | 10 | 10 |
| HPMC (mg) | 525 | 525 | 650 | 400 | 650 | 400 | 400 | 650 | 525 |
| PEG 400(mg) | 125 | 100 | 100 | 125 | 150 | 100 | 150 | 125 | 150 |
| Mannitol (mg) | 45 | 45 | 45 | 45 | 45 | 45 | 45 | 45 | 45 |
| Peppermint (ml) | 0.1 | 0.1 | 0.1 | 0.1 | 0.1 | 0.1 | 0.1 | 0.1 | 0.1 |
| Water (ml) | 10 | 10 | 10 | 10 | 10 | 10 | 10 | 10 | 10 |
| Ethanol (ml) | 10 | 10 | 10 | 10 | 10 | 10 | 10 | 10 | 10 |
Characterization Pre-formulation Studies:
Melting Point: The melting point for the febuxostat drug calculated by using digital melting point instrument.
Solubility: The solubility of febuxostat is determined under various solvents like distilled water, ethanol, methanol, acetone.
Determination of λmax: For making a stock solution with a conc. of 1000µg/ml, 10 mg precisely measured Febuxostat was mixed with 10 ml of ethanol in volumetric flask, that volume adjusted by ethanol to appropriate level. Two to five minutes were spent sonicating the solution 17.
Calibration Curve of Febuxostat in Ethanol: A workable solution with a saturated of 10µg/ml created suitably diluting the stock solution A succession of volumetric flask of 10 ml were filled with aliquots of the working solution, and the volume within every flask was reconciled to 10 ml with ethanol in order for reach a concentration of limit of 2 to 10 µg/ml the calibration graphs of absorbance vs concentration under experimental condition were shown a linear relationship between 2 and 10 µg/ml. Using ethanol as a blank, the solution was examined between 200 and 400 nm in the UV spectrum, and the absorbance maximum was found to be 316 nm 18.
Precision: The degree of agreement between independent test findings acquired under ideal circumstances is known as a method of precision in table of result and discussion. The findings of febuxostat concentration in the linear range in the same day (intraday) and in interday precision 19.
Accuracy: Studies on recovery were conducted for assess the accuracy of suggested approach by adding varying concentration (80%, 100% and 120%) of Febuxostat bulk sample to 5 µg/ml in order to ensure that the total concentration would fall within the linearity range. The accuracy was stated as a percentage of recovery 20.
Fourier Transforms Infrared Analysis (FT-IR): The febuxostat sample was analyzed using infrared spectroscopy to describe the probable structural change that took place. The range of the material's examination was 4000–400 cm-1. The medication was kept solid for assessment using a sample holding surface. Likewise, polymer spectrum measurements were made 21.
Differential Scanning Calorimetry: The pure drug, polymers and physical mixture have their DSC thermograms measured after being maintained at 40 2oC and 75 5%RH. All sample were put in airtight hermetically sealed aluminum crucible. Heated at 10oC per minute and scanned between 30 and 300oC. Thermogram of pure drug and excipients was recorded using Thermal analyzer (Shimadzu) 22.
Evaluation Parameters of Prepared Fast Mouth Dissolving Strip:
Organoleptic Properties: It is important to analyze the organoleptic parameters of the manufacturing fast mouth dissolving strips. The tests such as appearance, color, taste, smell and texture of the formulated strips are observed and analyzed 23.
Thickness Uniformity: A electronic micrometer was used to measure thickness of strips. Every strips thickness were measured at 5 separate points, the average was computed. The thickness standard deviation was calculated using the mean value 24.
Moisture Content and Moisture Uptake:
Moisture Uptake: Strips that have been previously weighed are kept inside the desiccators at specific temperature, relative humidity to conduct for test. To ascertain the proportion of moisture absorption, the strip is removed and reweighed after three days. The equation that follows to determine the % of moisture uptake 25.
Percent of moisture uptake = Final weight – Initial weight / Initial weight × 100
Moisture Content: Strip have been previously weighed are put for whole day in a desiccator. When weight changes of every individual strip are chosen as final weight of strip 26. The following equation can be utilized to determine % of moisture content 26.
Percent of moisture content = Initial weight – Final weight / Initial weight × 100
Drug Content Uniformity: Strips (3 samples from every strips) dissolved in ten ml phosphate buffer at pH of 6.8 while being shaken concurrently for a number of hours to assess content uniformly. Utilizing UV spectrophotometry, solution’s absorbance was determined at 316 nm. Every experiment was run in triplicate 27.
Weight Uniformity: According to the IP method, 3 strips with similar specifications were chosen from each formulation and subjected to a weight variation test on digital balance. Average these 3 strips taken from weighing of these each strip 28.
Tensile Strength: Tensile strength is the maximum stress that a strip can bear before breaking.
The amount of weight at which a strip broke is known as load failing, and a strip should have a high tensile strength. The degree of tensile strength determined utilizing the given formula, which divides applied load at rupture by strip's cross-sectional area 29.
Tensile strength = Load failure / Cross sectional area × 100
Disintegration Test: The disintegration instrument specified in the official pharmacopoeia is referred to determine a strip’s disintegration time. Since it varies depending on formulation, disintegration time normally varies stating with 5 to 30 sec. and is a function of the strip composition. Test conducted at room temperature. Ideal fast mouth dissolving strip shows disintegration time below 20 sec. The USP disintegration device is frequently used to do this test 30.
Folding Endurance: The strip's flexibility is evaluated using a metric called folding endurance. A tiny strip was folded multiple times until it broke in order to test its folding resistance. The multiple folds the strip withstand prior to breaking the measure of folding endurance 31. The results were displayed in a table.
Surface pH: After putting chosen strip in a glass dish within five milliliters phosphate buffer (pH=6.8), surface pH calculated. The pH determined through immersing the end of pH meter (Corning pH-meter 120, USA) in phosphate buffer for 1 min after the strip after that check the Ph 32.
Swelling Index: Study on strip's swelling index are run using stimulated saliva. After being weighed, the strip sample is put through a wire sieve made up of stainless steel. Strip which includes mesh is submerged in 50 milliliters contain salivary media that are active (phosphate buffer) that is held in a mortar. At each interval, weight of strip is increased until steady weight is noted 33.
Following equation is utilized to determine extent swelling:
SI = Wt – Wo / Wo
Whereas, SI: Swelling index, Wt: weight of strip at time “t”, Wo: weight of strip at time “o”.
In-vitro Drug Release: USP Dissolution type II testing instrument (paddle type) is used for measure drug's release rate. After being trimmed to the proper size, the strip is put in the dissolving media. 500 milliliters of newly made phosphate buffer (pH of 6.8), was keep at 37 ± 0.5 ºC, agitated at 50 rpm make up the dissolving medium. At various intervals 5 min, 10 min, 15 min, 20 min, 25 min, 30 min and 45 minutes, 3 ml samples are removed and to maintain a consistent dissolution media volume during the dissolution procedure, substitute the equal amount of new dissolution media. The samples undergo UV analysis, and the drug release percentage is computed 34.
In-vivo Bioavailability Study: The animals were starved for 12 hours the night before application. The animal had unrestricted access to water while fasting.
Two groups of three rats each were randomly selected from among the animals. The rats were anesthetized with ketamine intravenously at dose 15 mg/kg prior each period. Rats were anesthetized.
Without being ingested and entering the rat's digestive system, the strip is retained beneath its tongue.
The API and marketed tablets (Febustat 80 mg) were given group. Each rat was then given its dose via gastric gavage.
Sterile heparinized tubes containing were used to collect blood samples from the retro-orbital plexus.
The rat's control blood samples were drawn right before the medication was given to them. Additional post-administration samples were collected at time periods of 0.05, 0.15, 1, 3, 6 and 12 hours. Plasma was then separated by centrifuging blood sample 10 minutes at 4500 rpm 20 oC 35.
Stability Study: The degree that a product maintains its quality with specific parameters during use, storage, or shelf life, is known as stability. Stability tests on the optimized formulation were carried out in compliance with International Conference on Harmonization's (ICH) guidelines 36. As recommendations of ICH guidelines, the strips, which was wrapped within the aluminum foil, went through carried out stability testing for 2 months on 40 ± 2°C and 75 ± 5% relative humidity. Over course of two month, then samples were collected on specific intervals of one month, the previously described procedure was used to examine the samples to changes within physical appearance and drug content uniformity. The tests conducted and the obtained data's average and standard deviation had been noted 37.
RESULTS AND DISCUSSION:
Preformulation Study: The melting point of the API febuxostat was observed under melting point instrument and it was found 211oC. The solubility of febuxostat is analyzed under four different solvents. Febuxostat is freely soluble in ethanol and methanol; in water is less soluble; and in slightly soluble in acetone.
Spectroscopic Analysis:
Determination of λmax: The λmax of febuxostat was found at 316 nm in ethanol by UV spectrophotometer.
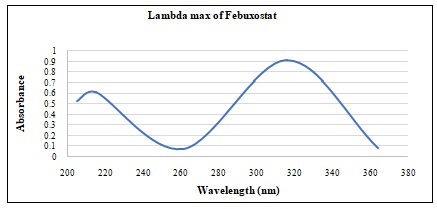
FIG. 1: λmax OF FEBUXOSTAT IN ETHANOL
Calibration curve of Febuxostat in Ethanol: At 316 nm, the UV absorption spectrum's peak was discovered.
Within its concentration range of 2–10 µg/ml, concentration vs. absorbance graph for pure drug was shown to be linear.
TABLE 3: OBSERVATION TABLE OF CALIBRATION CURVE OF FEBUXOSTAT
| Concentration (µg/ml) | Absorbance |
| 2 | 0.212 |
| 4 | 0.418 |
| 6 | 0.648 |
| 8 | 0.832 |
| 10 | 1.095 |
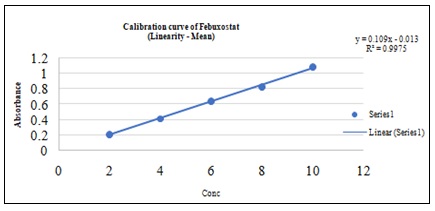
FIG. 2: CALIBRATION MEAN CURVE OF FEBUXOSTAT AT 316NM
Precision: By performing three separate analyses of the drug at a certain concentration on the same day, separated by two hours, at morning 10 am, noon 12 pm and afternoon 2 pm, respectively, intraday was done with precision. Evaluating the sample every three day allowed for determination of the inter day precision. The Table 4 displays results of both intraday as well as inter day precision.
TABLE 4: RESULT FOR INTRADAY AND INTER DAY PRECISION OF FEBUXOSTAT
| Precision result | ||||||
| Conc. taken (µg/ml) | Conc. obtained (µg/ml) | Mean | SD | % RSD | ||
| 10.00 AM | 12.00 PM | 2.00 PM | ||||
| 10 | 8.986 | 9.007 | 9.143 | 9.044 | 0.081 | 0.88 |
| 9 | 7.702 | 7.782 | 7.881 | 7.787 | 0.10 | 1.16 |
| 8 | 7.701 | 7.503 | 7.602 | 7.6 | 0.10 | 1.12 |
| Interday Precision | ||||||
| Conc. taken (µg/ml) | Conc. obtained (µg/ml) *(n=3) | Mean | SD | Percent RSD | ||
| 1st Day | 2nd Day | 3rd Day | ||||
| 10 | 9.323 | 9.357 | 9.436 | 9.372 | 0.051 | 0.51 |
| 9 | 8.289 | 8.357 | 8.359 | 8.338 | 0.041 | 0.41 |
| 8 | 6.486 | 6.558 | 6.62 | 6.551 | 0.060 | 0.91 |
Accuracy: The degree to which is test findings resemble an actual value is an indicator of an analytical method’s accuracy.
TABLE 5: RESULT FOR ACCURACY
| Level of recovery | Initial conc.
(µg/ml) |
Added drug conc.
|
Amount
Recovered (µg/ml) |
Percent
Recovery |
Percent
RSD |
| 20 | 10 | 2 | 11.82 | 98.57 | 0.226 |
| 40 | 10 | 4 | 14.02 | 100.08 | 0.626 |
| 60 | 10 | 6 | 15.93 | 99.6 | 0.251 |
Drug Excipient Compatibility Study:
FT-IR: FTIR spectroscopy was performed to investigate the compatibility of febuxostat with the selected excipients (HPMC E5 LV and PEG 400). The FTIR spectra of pure febuxostat, HPMC E5 LV, PEG 400, and their physical mixture were analysed and compared.
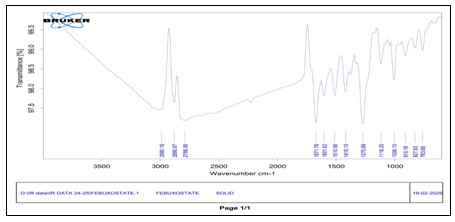
FIG. 3: FTIR SPECTRA OF FEBUXOSTAT
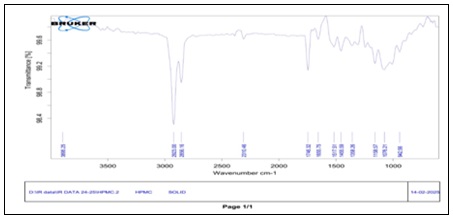
FIG. 4: FTIR SPECTRA OF HPMC
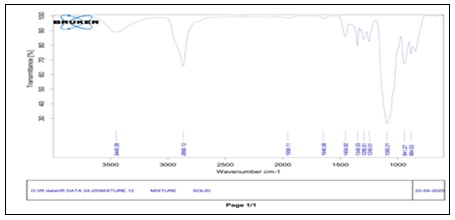
FIG. 5: FTIR SPECTRA OF PEG- 400
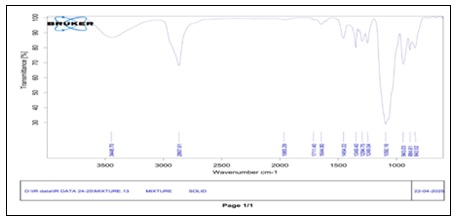
FIG. 6: FTIR SPECTRA OF MIXTURE OF API AND POLYMERS
The FTIR spectrum of pure febuxostat exhibited characteristic absorption peaks at 2990.18 cm⁻¹ corresponding to aromatic/aliphatic C–H stretching vibrations, 1671.78 cm⁻¹ corresponding to the carbonyl (C=O) stretching vibration, and 1270.89 cm⁻¹ attributed to C–N and C–O stretching vibrations. Additional peaks observed in the region of 1601.62–1510.56 cm⁻¹ were associated with aromatic ring vibrations, confirming the characteristic functional groups of febuxostat. The FTIR spectrum of HPMC E5 LV showed a broad absorption band at 3895.25 cm⁻¹ due to O–H stretching of hydroxyl groups, a peak at 2923.00 cm⁻¹ corresponding to aliphatic C–H stretching, and characteristic bands in the region of 1158.57–1076.21 cm⁻¹ attributed to C–O–C and C–O stretching vibrations of the cellulose ether backbone. These peaks are consistent with the reported structure of HPMC. The FTIR spectrum of PEG 400 exhibited a broad O–H stretching band at 3449.28 cm⁻¹, C–H stretching vibrations around 2866.12 cm⁻¹, and characteristic ether (C–O–C) stretching bands in the fingerprint region, confirming the presence of polyethylene glycol. The FTIR spectrum of the physical mixture showed characteristic peaks at 3449.28 cm⁻¹ (O–H stretching), 2866.12 cm⁻¹ (C–H stretching), 1646.08 cm⁻¹ (carbonyl/aromatic vibration region), 1349.31 cm⁻¹ and 1295.61 cm⁻¹ (C–N/C–O stretching), and 1093.21 cm⁻¹ (C–O–C stretching). The major characteristic peaks of febuxostat were retained in the physical mixture with only minor shifts in peak positions and intensities. Such minor variations are commonly attributed to intermolecular hydrogen bonding and physical mixing of components rather than chemical interaction. Therefore, the FTIR results indicate the absence of any significant chemical interaction between febuxostat and the formulation excipients (HPMC E5 LV and PEG 400), demonstrating their compatibility and suitability for the development of febuxostat-loaded fast mouth dissolving strips.
DSC Studies: Differential scanning calorimetry is and unique tool utilized to ascertain compatibility between the febuxostat and formulation excipients. The DSC thermograms of plain febuxostat and physical mixture of febuxostat and excipients of and excipients is displayed in Fig. 10. DSC thermogram of plain febuxostat Fig. 7, and HPMC E5 LV Fig. 8, PEG 400 DSC thermogram displayed in Fig. 9 showed peaks corresponding to febuxostat at 219.45 oC. The DSC thermogram of HPMC E5 LV exhibited a broad endothermic peak at 82.05°C (onset: 43.93°C, endset: 125.73°C). This broad endothermic transition is attributed to the loss of absorbed and bound moisture present in the hydrophilic polymer matrix. The DSC thermogram of PEG 400 showed a sharp endothermic peak at 58.71°C with an onset temperature of 54.84°C and an endset temperature of 61.94°C. On the other hand, DSC thermogram of physical mixture of febuxostat and excipients endothermic peak is 142.73 oC. Thus, obtained results revealed that integrity of febuxostat was retained after combining with excipients which conforms compatibility of febuxostat with formulation excipients. The observed shift in the endothermic peak suggests partial reduction in crystallinity and molecular dispersion of febuxostat within the polymer matrix. However, the absence of new degradation peaks and the retention of characteristic FTIR bands indicate no significant chemical incompatibility between febuxostat and the selected excipients.
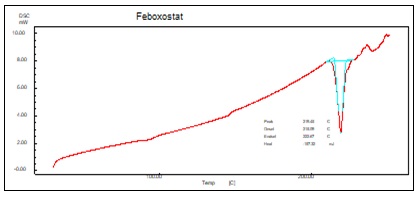
FIG. 7: DSC OF FEBUXOSTAT
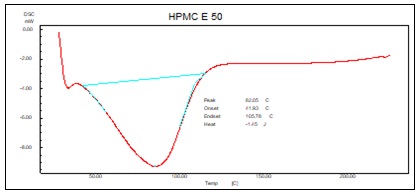
FIG. 8: DSC OF HPMC E5 LV
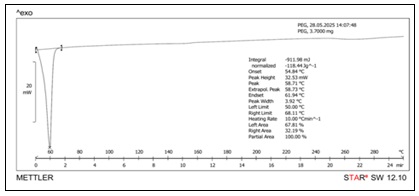
FIG. 9: DSC OF PEG 400
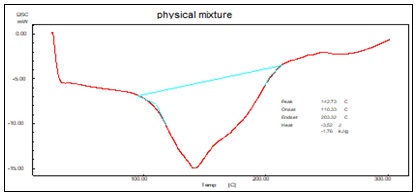
FIG. 10: DSC OF PHYSICAL MIXTURE
Results of Experimental Design: It was evident from the DOE results that drug release rises with a decrease in HPMC content. On the other hand, the disintegration time increases as the decrease in PEG 400 concentration. Following the DOE study, the following outcome was obtained.
TABLE 6: FACTORIAL DESIGN APPROACH
| Batch codes | Independent variables | Dependent variables | ||
| Factor 1 | Factor 2 | Response 1 | Response 2 | |
| A: HPMC E 5 LV | B: PEG 400 | Cumulative Drug Release | Disintegration Time | |
| (mg) | (mg) | (Percent) | (Second) | |
| B 1 | 525 | 125 | 52.61 | 30 |
| B 2 | 525 | 100 | 42.45 | 45 |
| B 3 | 650 | 100 | 30.39 | 60 |
| B 4 | 400 | 125 | 46.91 | 15 |
| B 5 | 650 | 150 | 46.39 | 45 |
| B 6 | 400 | 100 | 67.96 | 15 |
| B 7 | 400 | 150 | 40.85 | 30 |
| B 8 | 650 | 125 | 28.7 | 45 |
| B 9 | 525 | 150 | 31.59 | 30 |
Fit Summary:
Response 1: % drug release
ANOVA for 2 Factorial Linear Model:
TABLE 7: ANOVA TEST RESULTS
| Sourece | Sum of square | df | Mean square | F - value | p - value | |
| Model | 965.74 | 3 | 321.91 | 5.85 | 0.0432 | Significant |
| A – HPMC E5 LV | 420.68 | 1 | 420.68 | 7.65 | 0.0396 | |
| B – PEG- 400 | 80.45 | 1 | 80.45 | 1.46 | 0.2805 | |
| AB | 464.62 | 1 | 464.62 | 8.45 | 0.0335 | |
| Residual | 274.93 | 5 | 54.99 | |||
| Cor Total | 1240.67 | 8 |
The coding factor is coded.
Type III sum of square is Partial.
Model of F-value 5.85 suggest that model is significant. Probability which is F-value this significant might because by noise is just 4.32%. Modeling terms viewed as when P-value is smaller than 0.0500, it is considered significant. A and AB serve as significant the terms of the model in this case. Modeling terms not significant if their values are greater than 0.1000 Model reduction can help your model if it has a lot of insignificant terms (excluding those required for uphold hierarchy).
Fit Statistics:
TABLE 8: FIT STATISTICS FOR DRUG RELEASE
| S. D. | 7.42 | R2 | 0.7784 |
| Mean | 4309 | Adjusted R2 | 0.6454 |
| C. V. % | 17.21 | Predicted R2 | 0.2874 |
| Adeq precision | 7.74.79 |
Since, the difference exceeds to 0.2, Predicted R2 of 0.2874 and Adjusted R2of 0.6454 are never as similar as one might often anticipate. This can indicate a serious blockage or a possible error with your information and/or model. Response to outliers, modification, modelling reduction, another factors should be considered.
Confirmation runs might be utilized to test all empirical theories. A message noise percentage is measured by Adeq Precision. More of 4 is identical ratio. A sufficient signal is shown by a coefficient of 7.748. Space for design can be traversed using this kind of modeling.
Coefficients in Terms Coded Factors:
TABLE 9: COEFFICIENT WITH CODED FACTORS
| Factor | Coefficient Estimate | df | Standard Error 95 % | Cl Low 95% | Cl High | VIF |
| Intercept | 43.09 | 1 | 2.47 | 36.74 | 49.45 | |
| A- HPMC E5 LV | 8.37 | 1 | 3.03 | -16.16 | -0.5915 | 1.000 |
| B- PEG- 400 | -3.66 | 1 | 3.03 | -11.44 | 4.12 | 1.000 |
| AB | 10.78 | 1 | 3.71 | 1.25 | 20.31 | 1.000 |
Keeping everything else equal, the coefficient estimation displays a probable change in factor value per unit change in reaction.
In orthogonal layout, average response of all runs is intercept. Coefficients are adjustments around factor properties median. VIFs are one whenever factors are orthogonal; multi-colinearity is indicated by VIFs in excess of 1 stronger the relationship between the variables, the greater VIF. On average, VIFs under ten are permitted to used.
Finalized formula with Coded Factors:
Drug Release = 43.09 + 8.37A - 3.66B + 10.78AB
The intercept value of 43.09 represents the average predicted drug release at the center point of the design when both factors are maintained at their coded zero levels. Reaction predictions for specific concentrations of each element can be created utilizing the equation that is represented by coded factors. By default, the digits +1 and -1 represent the highest and lowest values of the components, respectively. By comparing factor coefficients, coded formula can be used for determine significance of elements.
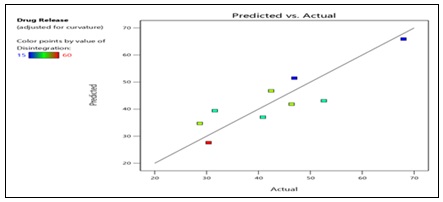
FIG. 11: PREDICTED VS ACTUAL PLOT FOR % CDR
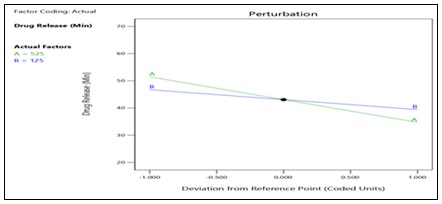
FIG. 12: ACTUAL PERTURBATION OF DRUG RELEASE
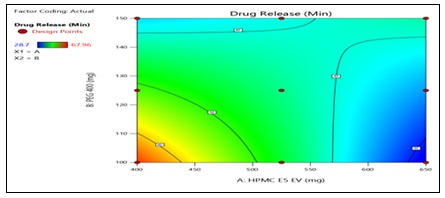
FIG. 13: 2D PLOT FOR % CDR
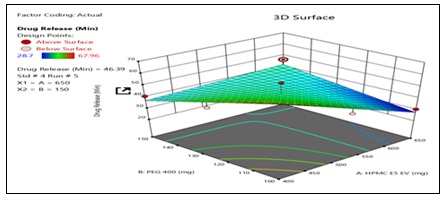
FIG. 14: 3D PLOT FOR % CDR
Fit Summary:
Response 2: Disintegration
ANOVA for 2 Factorial Linear Model:
TABLE 10: ANOVA TEST RESULTS
| Source | Sum of Square | df | Mean Square | F - value | P-value | |
| Model | 1612.50 | 3 | 537.50 | 14.33 | 0.0069 | Significant |
| A – HPMC E5 LV | 1350.00 | 1 | 1350.00 | 36.00 | 0.0018 | |
| B – PEG- 400 | 37.50 | 1 | 37.50 | 1.00 | 0.3632 | |
| AB | 225.00 | 1 | 225.00 | 6.00 | 0.0580 | |
| Residual | 187.50 | 5 | 37.50 | |||
| Cor Total | 1800.00 | 8 |
The coding factor is Coded. In Type III sum of square is Partial
The model's F-value indicates its importance 14.33. It is possible that F-value so high might be because of noise is merely 0.69%. The terms of the model when the P-value has less below 0.0500, they are regarded as significant. A is good modeling term in case. The modeling terms will never be important if the numbers are greater over 0.1000. If your model has a large number of unwanted terms, modeling reduction could improve it (excluding those required to uphold hierarchy).
Fit Statistics:
TABLE 11: FIT STATISTICS FOR DISINTEGRATION TIME
| SD | 6.12 | R2 | 0.8958 |
| Mean | 35.00 | Adjusted R2 | 0.8333 |
| C. V. % | 17.50 | Predicted R2 | 0.5651 |
| Adeq precision | 11.0227 |
The discrepancy exceeds 0.2, indicating that predicted R2 of 0.5651 and Adjusted R2 of 0.8333 they're not as near as one might frequently think. This can indicate a serious barrier impact or an eventual error and throughout your model or data. Response to outliers, response modification, model reduction, along with additional elements that need to be considered. Confirmation runs are supposed to be utilized to study all empirical models. Message to noise percentage measured with Adeq Precision. More than 4 is identical ratio. An adequate signal is shown by your ratio of 11.023. Space for design can be moved with this kind of modeling.
Coefficients in Term of Coded Factors:
TABLE 12: COEFFICIENTS FOR FACTORS THAT ARE CODED
| Factors | Coefficient Estimate | Df | Standard Error 95% | Cl Low 95% | Cl High | VIF |
| Intercept | 35.00 | 1 | 2.04 | 29.75 | 40.25 | |
| A – HPMC E5 LV | 15.00 | 1 | 2.50 | 8.57 | 21.43 | 1.0000 |
| B – PEG- 400 | -2.50 | 1 | 2.50 | -8.93 | 3.93 | 1.0000 |
| AB | -7.50 | 1 | 3.06 | -15.37 | 0.3708 | 1.0000 |
Whenever all Desired elements remain unchanged, the estimated variation in reactions for every unit change in element value is displayed by the value of the coefficient estimation. The intercept within an orthogonal designing is mean response of all runs. Coefficients are changes around the middle point based on factor aspects. When elements are orthogonal, VIF is 1, multi-colinearity is indicated by VIFs greater than one; greater more seriously elements are correlated, which increases the VIF. In general, VIFs less than ten permissible.
Finalized formula with Coded Factors:
Disintegration = 35.00 + 15.00A – 2.50B – 7.50AB
For specific concentrations of every component, equation in respect to coded elements can be used to make predictions related response. By convention, component’s both highs and lows levels are symbolized, correspondingly, by the numerals +1 and -1. By examining factor coefficients, coded equation can be used for calculate element's respective impacts.
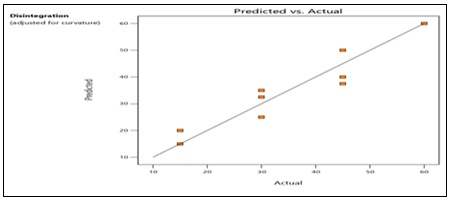
FIG. 15: PREDICTED VS ACTUAL PLOT OF DISINTEGRATION
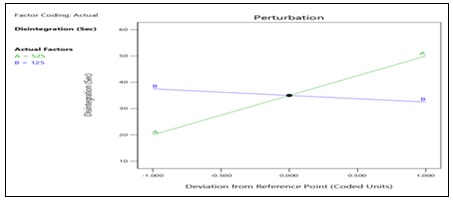
FIG. 16: PERTURBATION OF DISINTEGRATION
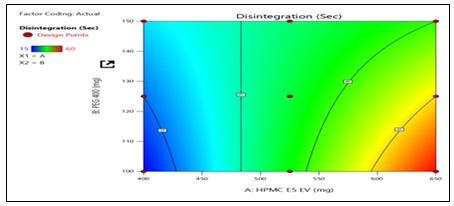
FIG. 17: 2D PLOT FOR DISINTEGRATION
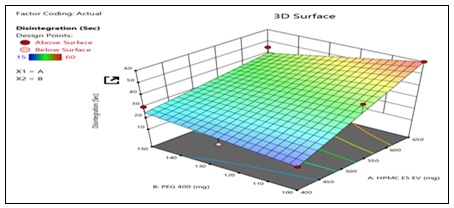
FIG. 18: 3D PLOT FOR DISINTEGRATION
TABLE 13: RESULT OF EVALUATION OF STRIP
| Formulation code | Appearance | Thickness
(mm) |
Moisture uptake (%) | Moisture content (%) | % Drug content
|
Weight uniformity (mg) |
| B1 | White, plane | 0.32 ± 0.083 | 3.02± 2.41 | 0.4 ± 0.312 | 67.11 ± 10.14 | 607.6 ± 64.856 |
| B2 | White, plane | 0.36 ± 0.114 | 3.06 ± 0.61 | 0.57 ± 0.087 | 73.41 ± 7.08 | 639.6 ± 8.962 |
| B3 | White, plane | 0.3 ± 0.158 | 6.1 ± 1.08 | 0.98 ± 0.145 | 70.33 ± 5.18 | 466.6 ± 15.275 |
| B4 | White, plane | 0.24 ± 0.114 | 4.57 ± 0.88 | 0.44 ± 0.207 | 55.11 ± 3.9 | 741 ± 10.408 |
| B5 | White, plane | 0.3 ± 0.122 | 6.98 ± 1.96 | 1.04 ± 0.176 | 63.04 ± 6.77 | 503.3 ± 71.619 |
| B6 | White, plane | 0.24 ± 0.114 | 6.19 ± 0.56 | 0.85 ± 0.18 | 87.99 ± 8.88 | 581.6 ± 9.609 |
| B7 | White, plane | 0.24 ± 0.054 | 7.4 ± 3.26 | 0.733 ± 0.19 | 70.38 ± 7.81 | 768.3 ± 16.072 |
| B8 | White, plane | 0.34 ± 0.151 | 7.95 ± 3.32 | 1.07 ± 0.202 | 45.64 ± 2.45 | 707.6 ± 15.502 |
| B9 | White, plane | 0.32 ± 0.083 | 5.01 ± 1.41 | 0.85 ± 0.17 | 53.32 ± 7.43 | 653.6 ± 52.595 |
TABLE 14: RESULT OF EVALUATION OF STRIP
| Formulation code | Tensile strength (g/cm2) | Disintegration time (sec) | Folding Endurance | Surface pH | % Swelling Index |
| B1 | 11.63 ± 0.37 | 30 ± 0.577 | 178 ± 7.737 | 6.36 ± 0.132 | 13.01 ± 1.64 |
| B2 | 8.07 ± 0.46 | 45 ± 0.577 | 175 ± 6.506 | 6.30 ± 0.175 | 16.16 ± 1.09 |
| B3 | 9.33 ± 0.38 | 60 ± 1 | 160 ± 6.027 | 6.64 ± 0.212 | 18.29 ± 1.84 |
| B4 | 4.59 ± 1.35 | 15 ± 0.577 | 151 ± 6.658 | 6.69 ± 0.109 | 15.62 ± 3.94 |
| B5 | 12.65 ± 0.59 | 45 ± 0.577 | 163 ± 5.507 | 6.51 ± 0.195 | 19.64 ± 2.53 |
| B6 | 5.27 ± 2.79 | 15 ± 0.577 | 166 ± 7.371 | 6.42 ± 0.105 | 17.98 ± 4.14 |
| B7 | 10.45 ± 0.83 | 30 ± 0.577 | 180 ± 9.018 | 6.64 ± 0.098 | 14.07 ± 2.52 |
| B8 | 13.2 ± 0.51 | 45 ± 0.577 | 170 ± 4.509 | 6.42 ± 0.147 | 13 ± 1.58 |
| B9 | 10.73 ± 0.94 | 30 ± 1 | 158 ± 8.504 | 6.74 ± 0.070 | 17.97 ± 4.83 |
TABLE 15: RESULT OF IN-VITRO DRUG RELEASE
| Batch No. | B1 | B2 | B3 | B4 | B5 | B6 | B7 | B8 | B9 |
| Time (minutes) | |||||||||
| 5 | 27.11 ± 1.94 | 13.45 ± 0.623 | 6.69 ± 0.075 | 14.04 ± 0.31 | 22.71 ± 1.19 | 32.04 ± 0.81 | 8.83 ± 0.80 | 3.63 ± 0.25 | 3.76 ± 0.38 |
| 10 | 30.17 ± 2.33 | 17.99 ± 0.626 | 7.06 ± 0.030 | 14.2 ± 0.222 | 28.48 ± 1.35 | 35.73 ± 0.92 | 13.87 ± 0.037 | 7.70 ± 0.35 | 6.58 ± 0.0709 |
| 15 | 31.84 ± 2.37 | 24.5 ± 0.84 | 7.43 ± 0.27 | 18.29 ± 0.34 | 28.2 ± 2.78 | 44.55 ± 1.02 | 18.53 ± 0.222 | 11.04 ± 0.78 | 11.19 ± 0.355 |
| 20 | 38.88 ± 2.26 | 24.78 ± 1.20 | 10.6 ± 0.100 | 23.07 ± 0.601 | 39.41 ± 1.37 | 52.29 ± 1.08 | 25.18 ± 0.59 | 13.44 ± 0.28 | 14.55 ± 0.091 |
| 25 | 47.58 ± 3.94 | 24.92 ± 1.27 | 11.56 ± 0.225 | 30.4 ± 0.17 | 46.05 ± 1.86 | 56.43 ± 0.82 | 31.22 ± 0.228 | 17.33 ± 0.25 | 18.43 ± 0.528 |
| 30 | 51.6 ± 3.73 | 42.06 ± 1.06 | 22.34 ± 0.425 | 36.11 ± 0.57 | 46.32 ± 1.33 | 60.03 ± 0.71 | 37.42 ± 0.66 | 20.32 ± 0.23 | 23.42 ± 0.109 |
| 45 | 52.61 ± 1.64 | 42.45 ± 0.58 | 30.39 ± 0.264 | 46.91 ± 0.13 | 46.39 ± 1.23 | 67.96 ± 1.85 | 40.85 ± 0.237 | 28.7 ± 0.22 | 31.59 ± 0.25 |
Selection of B6 as the optimized batch was not based solely on drug release. The formulation exhibited the shortest disintegration time (15 ± 0.577 s), the highest drug content (87.99 ± 8.88%), acceptable mechanical properties, suitable surface pH, and the highest cumulative drug release among all experimental batches. The optimized formulation B6 exhibited a cumulative drug release of 67.96 ± 1.85% at 45 min, which was the highest among all the formulations evaluated in the present study. Although the release did not reach complete drug dissolution, B6 demonstrated a significantly superior release profile compared with the remaining batches, where the cumulative drug release ranged from 28.70% to 52.61% at 45 min.
In-vivo Bioavailability Study: After 12 h the concentration of Febuxostat API, Formulation and marketed formulation in the plasma was approximately 63.18112704 μg/ml, 150.43562 μg/ml and 426.38714 μg/ml respectively. So, formulation showing good bioavailability as compared to the Febuxostat API. The results from the in-vivo oral pharmacokinetic examination findings revealed a substantial rise in AUC for formulation and marketed formulation.
The AUC 0-t for formulation was found to be higher as compared febuxostat optimized batch i.e. 965.23476μg/ml*h. Tmax was found to be 0.05 h for formulation.
After giving onset of action at 12 hours febuxostat formulation is eliminating fastly as compared to the API. The project proposal No. IRDI/IAEC/M05/08/2025-26.
TABLE 16: CALCULATION RESULTS (FEBUXOSTAT OPTIMIZED BATCH)
| Parameter | Unit | Value |
| Lambda_z | 1/h | 0.037982529 |
| T1/2 | h | 18.24.910561 |
| Tmax | h | 0.05 |
| Cmax | 150.4356239 | |
| Tlag | h | 0 |
| AUC 0-t | µg/ml*h | 965.2347618 |
| MRT0_inf_obs | h | 26.098124 |
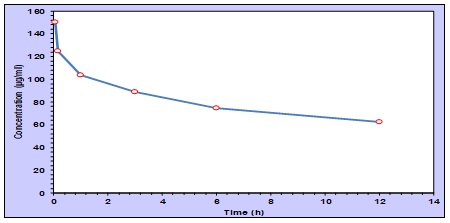
FIG. 19: TIME (H) VS CONCENTRATION (µg/mL) – FEBUXOSTAT OPTIMIZED BATCH
Stability Study: The formulation stability was examined under conditions of increased humidity and temperature. The strip’s physical changes and drug content were assessed during the stability study periods. Following the stability study, no appreciable changes were observed in the B6 characteristics. Table 15 shows the drug release profile and other parameters of B6 batch before and after the stability analysis. This shows that the formulation B6 release profile was not significantly impacted by temperature and humidity variations between them 37.
TABLE 17: RESULT OF STABILITY STUDY
| Stability condition | Sampling interval | Drug content (%) | Disintegration time (sec) | Surface pH |
| 40oC and 75 % relative humidity | 0 | 87.99 ± 8.88 | 15 ± 0.577 | 6.42 ± 0.105 |
| 1 | 76.69 ± 4.24 | 16.03 ± 0.907 | 6.41 ± 0.01 | |
| 2 | 72.85 ± 4.59 | 17.2 ± 0.964 | 6.39 ± 0.01 |
DISCUSSION: A gout is chronic condition in which deposition of uric acid in the joint of bone especially of the toes, knees and fingers. Due to the gout pain and inflammation occur. to reduce this pain and uric acid deposition in joint the medications are prepared with analgesic, uric acid reducer, nonsteroidal anti-inflammatory drugs, anti-inflammatory steroids, etc. examples of drugs are allopurinol, probenecid, sulfinpyrazone, febuxostat. The oral drug delivery is very fast process to reaching into the systemic circulation. Hence in the formulation prepared with the orally fast mouth dissolving strips. The current purpose of this investigation is to establish, evaluate the fast mouth dissolving strip used for the treatment of gout. Febuxostat rapid dissolving strips were prepared using a 2-factor, factorial design with 3 level. For fast dissolving strips, the percentage of HPMC and PEG-400 were chosen a independent variable, while disintegration period and % CDR chosen dependent variable. The solvent casting technique is utilized for prepare the strip with hydroxypropyl methyl cellulose, PEG-400, mannitol, peppermint oil, water, and ethanol.
Among all formulations, B6 exhibited the shortest disintegration time (15 ± 0.577 s), which is a primary requirement for fast mouth dissolving strips. Rapid disintegration facilitates quick hydration and drug availability in the oral cavity, thereby improving patient compliance and onset of action. The formulation also showed the highest drug content (87.99 ± 8.88%) among all batches, indicating comparatively better drug incorporation within the polymeric matrix. Furthermore, B6 demonstrated the highest cumulative drug release (67.96 ± 1.85%) at 45 min compared with the other formulations evaluated in the study. Although complete drug release was not achieved, the formulation provided superior release performance relative to the remaining batches. The factorial design optimization further identified B6 as the formulation providing the most desirable balance between the two critical responses, namely minimum disintegration time and maximum drug release.
Thickness, moisture content and uptake, drug content, uniformity, organoleptic characteristics, variability in weight, tensile strength, test for disintegration, folding endurance, the assessment parameters of the febuxostat strip, including surface pH, swelling index, and surface pH, were all examined. Stability test and in-vitro dissolution are utilized to determine the best formulation. In order to further examine the improved batch of febuxostat batch B6, in-vivo bioavailability study also performed on the animal. Oral route of administration was studied in order to evaluate their impact on febuxostat bioavailability and release profile over 12 hours for API, formulation and marketed formulation. ln addition to avoiding the first pass metabolism and providing a maximum medication release of 67.96 % within the time frame, which greatly enhanced anti-gout effectiveness.
The formulation exhibited a gradual decrease in drug content from 87.99 ± 8.88% at the initial time point to 76.69 ± 4.24% after one month and 72.85 ± 4.59% after two months. This reduction indicates a significant loss of drug content during storage under accelerated conditions and suggests possible degradation of febuxostat and/or moisture-induced changes in the film matrix. Therefore, it cannot be concluded that the optimized formulation is stable under the investigated accelerated conditions. The results indicate that further formulation optimization, including the use of suitable stabilizers, moisture-protective packaging, or modification of the polymeric composition, may be necessary to improve the long-term stability of febuxostat fast mouth dissolving strips.
Comparing the in-vitro dissolving investigation to the commercial formulation reveals improvable results as well. Thus, it suggests an innovative medication delivery method for febuxostat in the management of gout.
CONCLUSION: Good drug dissolution rate and appropriate qualities were demonstrated by the optimized febuxostat rapid dissolving strips. Fast-hydrated strips were used to introduce the medication. The high rate and extent of medication absorption in systemic circulation are caused by the strip’s high disintegration rate and large surface area of drug exposure. The findings demonstrated that a fast mouth dissolving strip containing 400 mg HPMC and 100 mg PEG 400 generated a good disintegration time and good % CDR that is 67.96 % within 45 minutes. This strip of febuxostat produced a positive result in in-vitro and in-vivo study. After 12 hours the AUC0-t is greater than API that is 965.234 µg/ml*h as well as a quicker action (tmax 0.05 h) an extended apparent t1/2, provided in-vivo justification for this. This suggested formula may be a viable substitute for patients with swallowing issues in children, geriatrics, etc., improving patient compliance. The future prospect for fast dissolving dosage forms are interesting dew to the emergence of newer methods, coupled with persistent demand from patients and buyer acceptance. According to current data, the best efficient and appealing form of oral dosage that offers most beneficial outcomes is the fast dissolving oral strip.
ACKNOWLEDGEMENTS: Nil
CONFLICTS OF INTEREST: Nil
REFERENCES:
- Smith E: The Global Burden of Gout: Estimates from the Global Burden of Disease 2010 Study. Ann Rheum Dis 2014; 73(8): 1470-6. PubMed PMID: 24590182.
- Brook RA, Forsythe A, Smeeding JE and Lawrence Edwards N: Chronic gout: epidemiology, disease progression, treatment and disease burden. Current Medical Research and Opinion 2010; 26(12): 2813-21.
- Roddy E and Doherty M: Gout. Epidemiology of gout. Arthritis Research and Therapy 2010; 12: 1-1.
- Tiwari G, Tiwari R, Sriwastawa B, Bhati L, Pandey S, Pandey P and Bannerjee SK: Drug delivery system: An updated review. International Journal of Pharmaceutical Investigation 2012; 2(1): 2-11.
- Homayun B, Lin X and Choi HJ: Challenges and recent progress in oral drug delivery systems for biopharmaceuticals. Pharmaceutics 2019; 11(3): 129.
- Bhati R and Nagrajan RK: A detailed review on oral mucosal drug delivery system. International Journal of Pharmaceutical Sciences and Research 2012; 3(3): 659.
- Christopher Squier and Kim A: Broaden, Human Oral mucosa Development, structure and function. John Wiley & Sons 2010; 168: 2-4.
- Kunte S and Tandale P: Fast dissolving strips: A novel approach for the delivery of verapamil. Journal of Pharmacy and Bioallied Sciences 2010; 2(4): 325-8. Doi- 10.4103/0975-7406.72133.
- Shaikh AK, Bhoye AH, Shah DP and Patel TJ: Mouth dissolving strips: A novel approach for drug delivery system. World J of Pharma Research 2018; 8(7): 360-78.
- Grewal HK, Martinez JR and Espinoza LR: Febuxostat: drug review and update. Expert Opinion on Drug Metabolism & Toxicology 2014; 10(5): 747-58.
- Hair PI, McCormack PL and Keating GM: Febuxostat. Drugs 2008; 68: 1865-74.
- Cada DJ, Levien TL and Baker DE: Febuxostat. Hospital Pharmacy 2009; 44(8): 688-99.https://doi.org/10.1310/hpj4408-688.
- Hu M and Tomlinson B: Febuxostat in the management of hyperuricemia and chronic gout: a review. Therapeutics and Clinical Risk Management 2008; 4(6): 1209-20.
- Grewal HK, Martinez JR and Espinoza LR: Febuxostat: drug review and update. Expert opinion on drug Metabolism & Toxicology 2014; 10(5): 747-58.
- (Bala R, Khanna S and Pawar P: Design optimization and in-vitro in-vivo evaluation of orally dissolving strips of clobazam. J Drug Deliv 2014; 2014: 392783. doi: 10.1155/2014/392783. Epub 2014 Sep 28. PMID: 25328709; PMCID: PMC4195261.)
- Hemavathy S, Sinha P, Ubaidulla U and Rathnam G: A detailed account on novel oral fast dissolving strips: application and future prospects. Department of Pharmaceutical 2022; 10(4): 773-787)
- Rajyalakshmi Ch: Development and Validation of Zero and First Order Derivative UV spectrophotometric method for Determination of Febuxostat in Bulk and in Formulation. RJPT 2013; 6(2): 208-211.
- Sowjanya G: Development and validation of a new derivative UV spectrophotometric method for simultaneous quantification of tizanidine and aceclofenac in tablets. RJPT 2020; 13(2): 569-574.
- (Samineni KK, Maddi VN, Sambasiva Rao KRS and Bhikshapathi DVRN: Preparation and in-vivo evaluation of oral dissolving films containing sumatriptan succinate. Scholars Research Library 2013; 5(3): 27-38.
- Akash V and Shailaja P: In-vitro and in-vivo evaluation of ezetimibe fast-dissolving films. Int J App Pharmaceutic 2023; 15(6): 108- 117. DOI: http://dx.doi.org/10.22159/ijap.2023v15i6.49110).
- Bhagwat AM: “Development and Validation of UV Spectroscopic Assay method of Febuxostat in Bulk and Dosage Form.” World Journal of Pharmaceutical Research 2017; 1042–1057. https://doi.org/10.20959/wjpr20174-8136
- Sowjanya G: New validated UV spectrophotometric methods for the determination of Febuxostat in bulk and formulation. CIB Tech J Pharma Sci 2014; 3: 7-13.
- Alim M: Validated UV spectrophotometric method for estimation of domperidone for dissolution study. Der Pharmacia Letter 2015; 7(6): 53-8.
- Batissa Violacea L. Von Lamarck, 1818) as Edible Film - Scientific Figure on ResearchGate. Available from: https://www.researchgate.net/figure/The-Organoleptic-of-Edible-Film_tbl3_332777949 [accessed 24 Apr 2025]
- Gorle A, Patil P, Bhaskar R and Ola M: Development and evaluation of buccal film containing antihypertensive agent. The Pharma Innovation 2015; 4(1): 53.
- Panda BP, Dey NS and Rao MEB: Development of innovative orally fast disintegrating film dosage forms: a review. International Journal of Pharmaceutical Sciences and Nanotechnology 2012; 5(2): 1666-1674.
- Mitra Jelvehgari, Seyed Hassan Montazam, Saieede Soltani, Rahil Mohammadi, Karim Azar and Seyed Ataollah Montazam: Fast Dissolving Oral Thin Film Drug Delivery Systems Consist of Ergotamine Tartrate and Caffeine Anhydrous. Pharmace Sci 2015; 21: 102-110.
- Morales JO and McConville JT: Manufacture and characterization of mucoadhesive buccal films. European J of Pharma and Biopharmaceutics 2011; 77(2): 187-99.
- (Mitali M. Vaidya, Nilesh M. Khutle and Parag S. Gide: Oral fast dissolving drug delivery system: a modern approach for patient compliance. World Journal of Pharmaceutical Research 2(3): 558-577.
- Pingale PL, Shinkar DM, Boraste SS and Amrutkar SV: Formulation evaluation and characterization of mouth dissolving film of cisapride. Current Trends in Biotechnology and Pharmacy 2022; 16(4): 490-9.
- Apoorva Mahajan, Neha Chhabra and Geeta Aggarwal: Formulation and Characterization of Fast Dissolving Buccal Films: A Review. Scholars Research Library 2011; 3(1): 152-165.
- Marziyeh Fathi, Mitra Alami-Milani, Sara Salatin, Sharahm Sattari, Hassan Montazam, Farhad Fekrat and Mitra Jelvehgari: Fast dissolving sublingual strips: a novel approach for the delivery of isosorbide dinitrate. Pharmaceutical Sciences 2019; 25(4): 311-318.
- Al-Mogherah AI, Ibrahim MA and Hassan MA: Optimization and evaluation of venlafaxine hydrochloride fast dissolving oral films. Saudi Pharmaceutical Journal 2020; 28(11): 1374-82.
- Sahar Salehi, Soheil Boddohi, New formulation and approach for mucoadhesive buccal film of rizatriptan benzoate. Prog Biomater 2017; 6: 175–187.
- Baby Lynthong, Bhavya Shree T, Krishnananda Kamath K and Shabaraya AR: Oro dispersible film: an effective approach for the quick drug release. Int J Pharm Sci Rev Res 2022; 75(2): 180-185.
- Basant A. Habib, Amina S. Abd El-Samiae, Boushra M. El-Houssieny & Randa Tag: Formulation, characterization, optimization, and in-vivo performance of febuxostat self-nano-emulsifying system loaded sublingual films, Drug Delivery 2021; 28: 1, 1321-1333, DOI: 10.1080/10717544.2021.1927247.
- Karthikeyan D, Sri S and Kumar CS: Development of fast dissolving oral film containing of rizatriptan benzoate as an antimigraine medication. Indo American Journal of Pharmaceutical Research 2013; 3(3): 2642-54.
How to cite this article:
Raval D, Magdum A, Magdum D, Mane R, Narsule M, Patil S, Shinde P and Badade K: Formulation, development and evaluation of febuxostat loaded fast mouth dissolving strip for the treatment of gout. Int J Pharm Sci & Res 2026; 17(10): 2985-01. doi: 10.13040/IJPSR.0975-8232.17(10).2985-01.
All © 2026 are reserved by International Journal of Pharmaceutical Sciences and Research. This Journal licensed under a Creative Commons Attribution-NonCommercial-ShareAlike 3.0 Unported License.
Article Information
13
2985-3001
1137 KB
8
English
IJPSR
Dhanashree Raval, Archana Magdum *, Disha Magdum, Rajashree Mane, Manasvi Narsule, Sayali Patil, Pratima Shinde and Karuna Badade
Sant Gajanan Maharaj College of Pharmacy, Mahagaon, Chinchewadi, Maharashtra, India.
asmsgmcp@gmail.com
19 May 2026
13 June 2026
19 June 2026
10.13040/IJPSR.0975-8232.17(10).2985-01
01 October 2026
 Download