




GREEN ANALYTICAL APPROACH FOR DEVELOPMENT AND VALIDATION OF AN HPTLC METHOD FOR QUANTIFICATION OF BUPROPION HYDROCHLORIDE IN TABLET DOSAGE FORM AND ITS GREENNESS ASSESSMENT
HTML Full TextGREEN ANALYTICAL APPROACH FOR DEVELOPMENT AND VALIDATION OF AN HPTLC METHOD FOR QUANTIFICATION OF BUPROPION HYDROCHLORIDE IN TABLET DOSAGE FORM AND ITS GREENNESS ASSESSMENT
Amisha H. Rohit, Bhavna A. Patel and Falguni Patel *
Department of Pharmaceutical Sciences, Sardar Patel University, Vallabh Vidyanagar, Gujarat, India.
ABSTRACT: Objective: The present study aimed to develop and validate a simple, rapid and environmentally acceptable HPTLC method for the quantitative estimation of bupropion hydrochloride in tablet dosage form and to evaluate its greenness profile using AGREE, GAPI, NEMI and Analytical Eco-scale tools. Methods: Chromatographic separation was achieved on silica gel 60 F254 precoated aluminium plates using methanol: chloroform: glacial acetic acid (1.5:8.5:0.3, v/v/v) as the mobile phase. Densitometric analysis was performed at 252 nm after a chamber saturation time of 15 min. The method was validated according to ICH Q2(R1) guidelines. Results: Bupropion hydrochloride exhibited a compact spot with an Rf value of 0.37 ± 0.001. The method showed linearity over the concentration range of 150–350 ng/band with a correlation coefficient of 0.9984. The assay of marketed tablets was found to be 98.44%. The recovery range was –%, indicating good accuracy. Precision studies showed %RSD values below 2%, confirming method precision. The LOD and LOQ were found to be 7.36 ng/band and 22.31 ng/band, respectively. Robustness studies indicated that small deliberate variations had no significant effect on chromatographic performance. Greenness assessment demonstrated an AGREE score of 0.69, Eco-scale score of 66 and favourable GAPI and NEMI profiles. Conclusion: The developed HPTLC method is simple, precise, accurate and suitable for routine quality control analysis of bupropion hydrochloride tablets. The greenness assessment indicated that the proposed procedure represents an environmentally acceptable analytical approach with reduced solvent consumption and waste generation.
Keywords: Bupropion hydrochloride, HPTLC, Validation, Green analytical chemistry, AGREE, GAPI, NEMI, Analytical Eco-scale
INTRODUCTION: Bupropion hydrochloride Fig. 1 is an aminoketone antidepressant widely used for the treatment of major depressive disorder, seasonal affective disorder and smoking cessation. Accurate and reliable analytical methods are essential for quality control and routine analysis of pharmaceutical formulations containing bupropion hydrochloride 1-5.
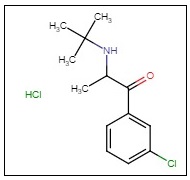
FIG. 1: STRUCTURE OF BUPROPION HYDROCHLORIDE
Several analytical methods, including UV spectrophotometry, HPLC, RP-HPLC and HPTLC, have been reported for the determination of bupropion hydrochloride in pharmaceutical dosage forms. Although these methods provide satisfactory analytical performance, some require sophisticated instrumentation, longer analysis time and higher solvent consumption. Therefore, there is a need for a simple, economical and environmentally acceptable analytical method suitable for routine quality control laboratories 6-22.
Green analytical chemistry emphasizes minimizing hazardous chemicals, reducing waste generation and improving sustainability of analytical procedures. Greenness assessment tools such as Analytical GREEnness (AGREE), Green Analytical Procedure Index (GAPI), National Environmental Method Index (NEMI) and Analytical Eco-scale provide systematic approaches to evaluate environmental impacts of analytical methods 23-29. In the present study, an HPTLC method was developed and validated for quantification of bupropion hydrochloride in tablet dosage form according to ICH Q2(R1) guidelines. In addition, the environmental sustainability of the developed procedure was evaluated using AGREE, GAPI, NEMI and Analytical Eco-scale assessment tools. The developed method provides a simple and economical alternative for routine pharmaceutical analysis with acceptable environmental characteristics.
MATERIALS AND METHODS:
Materials: Bupropion hydrochloride was obtained as a gift sample from Torrent Pharmaceutical Limited, Ahmedabad, Gujarat, India. Tablet Bupron XL 150 was purchased from local pharmacy store. All chemicals and solvents were of analytical grade provided by Sisco Research Lab Pvt Ltd, Andheri, Mumbai. All the glassware was provided by the Department of Pharmaceutical Sciences, Sardar Patel University, Vallabh Vidyanagar, Anand. All the glassware was calibrated before using.
Preparation of BUP Standard Stock Solution (1000 µg/mL): Accurately weighed 10mg of BUP was transferred into 10mL volumetric flask and dissolved in methanol, diluted up to the mark with methanol to get a stock solution containing 1000µg/mL of BUP.
Preparation of BUP Working Standard Solution (50 µg/mL): 0.5mL of BUP standard stock solution was diluted to 10mL with methanol to get working standard solution containing 50µg/mL of BUP.
Sample Preparation for Analysis of Marketed Formulation: 10 tablets were weighed accurately and finely powdered. Tablet powder equivalent to 50mg of BUP was accurately weighed and transferred to a 10 mL volumetric flask, sonicated for 10-15 min and volume was made up mark to obtain 5000μg/mL and the solution was filtered using 0.45µ Millipore filter. An aliquot of 1 mL was transferred to the 10mL volumetric flask and volume was made up to mark to obtain 500μg/mL of BUP. An aliquot of 1 mL was transferred to the 10mL volumetric flask and volume was made up to mark to obtain 50μg/mL of BUP. The solution was filtered using 0.45µ Millipore filter.
Chromatographic Conditions: Quantification of Bupropion hydrochloride was carried out on TLC Aluminium sheet precoated with silica gel G60 F254 (20×20 cm2) E. Merck, Germany. Various concentrations of bupropion hydrochloride were applied on TLC plates as a 6mm band with the help of semiautomatic sample applicator Linomat V, using Hamilton syringe (100µL). The sample application rate was kept constant at 150 nL s-1. The TLC plate were developed at linear ascending mode at a distance of 80 mm with methanol: chloroform: glacial acetic acid 1.5:8.5:0.3 (v/v/v) as a mobile phase in Camag twin trough chamber (10×10 cm). Scanning was carried out on a Camag TLC scanner IV (scanning speed up to 100mm/s, spectral range 190-800 nm). UV Cabinet Dual wavelength 254 and 366 nm. Software used was Camag win CATS software 1.4.7
Identification of Drug:
Identification of Drug Substance by Melting Point: The melting point is the temperature at which a solid change into a liquid at a particular pressure.
Take the sample used for the determination of residual humidity, crush about 0.1 g of material in a mortar with help of pastel to gain size of about 0.1mm. Then fill the substance into the capillary tube to about 5-10 mm by taking up the sample with tube and filling it up to the prescribed level by knocking (or dropping in a glass tube) the sealed end on a solid base. Introduce the filled capillary tube into the melting point apparatus and set the heating up at a rate of 5ºC/min. The change from solid to liquid state is visually observed and the starting and ending melting point is noted.
Identification of Drug Substance by Wavelength Maxima: For wavelength maxima selection, 10µg/mL of Bupropion hydrochloride solution was prepared and scanned between 200-400 nm wavelengths using UV spectroscopy. Observed λmax was compared with reported λmax.
Identification of Drug Substance by Infrared Spectrophotometry: Compare the spectrum with that obtained with RS or with the reference spectrum.
Selection of Wavelength:
Test Solution: 50µg/mL solution of BUP was prepared in methanol. 5 µl of solution was applied on silica plate with band length of 6 mm using CamagLinomat V. The mobile phase was allowed to rise by 80 mm. The plate was dried in air until the odour of the solvent was no longer detectable. It was examined in ultraviolet light at 254 nm. The developed spot was scanned over 200-700 nm range and spectrum of BUP was recorded to select the detection wavelength using HPTLC.
Method Validation: This method was validated for the parameters given below as per ICH guideline Q2 (R1).
Specificity/ Selectivity: Specificity/selectivity can be shown by demonstrating that the identification and/or quantitation of an analyte is not impacted by the presence of other substances (e.g., impurities, degradation products, related substances, matrix, or other components present in the operating environment).
Linearity: The linearity of HPTLC method for bupropion hydrochloride was studied by plotting the concentration against measured peak area of bupropion hydrochloride. The linearity was evaluated in the range of 150-350 ng/band.
Validation of Lower Range Limits: Detection (LOD) and quantitation (LOQ) limits were obtained using standard deviation (SD) method. LOD and LOQ were calculated by applying equation (1) and (2):
LOD = 3.3 × SD / S (1)
LOD = 10 × SD / S (2)
Where σ represents the standard deviation of the response and S represents the slope of the calibration curve.
Precision: Precision of the proposed HPTLC method was obtained in terms of repeatability, intra-day and inter-day precision.
Repeatability: Repeatability expresses the precision under the same operating conditions over a short interval of time.
Spot Applicator Repeatability: Here, the precision of spot applicator was checked by spotting 5μL of BUP drug solution six times on a TLC plate, followed by development of plate and recording the peak area for six spots.
Scanner Repeatability: Here, the precision of the scanner was checked by scanning the same plate for six time and recording the peak area.
Intra-day Precision: Intraday precision was performed by analysing the concentration of BUP (200, 250 and 300 ng/band) at 0, 2 and 4 hours on the same day.
Inter-day Precision: Inter day precision performed was by analysing the concentration of BUP (200, 250 and 300ng/band) at day 0, day 2 and day 4.
Accuracy: Accuracy was determined by calculating the % recovery by standard addition method. Known amount of standard solution of 0 ng/spot, 120 ng/spot, 150 ng/spot, 180 ng/spot of BUP was added in pre-analysed sample solution of marketed formulation spiking (150 ng/band) which gives solution having strength of 0%, 80 %, 100% and 120 % of target concentration from the range, each solution was injected in triplicates and recovery was calculated.
Robustness: It was carried out using 250ng/band sample solution of BUP by alteration in different parameters like, change in wavelength, change in slit dimensions, change in band length, change in mobile phase composition and change in solvent migration distance.
Green Analytical Chemistry: Following parameters were applied to evaluate greenness of the method:
- AGREE
- GAPI
- NEMI
- Analytical Eco-scale assessment
RESULTS AND DISCUSSION:
Identification of Drug Substance by Melting Point: Melting point of Bupropion hydrochloride was determined using melting point apparatus. The melting point range of the drug is mentioned in Table 1.
TABLE 1: MELTING POINT OF BUP
| Sr. no. | Name of the drug | Standard value | Observed value |
| 1. | Bupropion hydrochloride | 233˚C - 234˚C | 230˚C - 236˚C |
Identification of Drug Substance by Wavelength Maxima: For wavelength maxima selection, 10µg/mL of Bupropion hydrochloride solution was prepared and scanned between 200-400 nm wavelengths using UV spectroscopy. Observed λmax was compared with reported λmax. Fig. 2 shows the UV spectra of Bupropion hydrochloride also mention in Table 2.
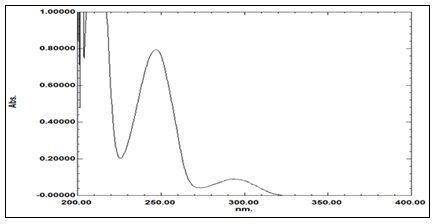
FIG. 2: UV SPECTRA OF BUP (10µg/mL)
TABLE 2: λMAX OF BUPROPION HYDROCHLORIDE
| Sr. no. | Name of drug | Reference λmax | Observed λmax |
| 1. | Bupropion hydrochloride | 252nm | 247.12nm |
Identification of Drug Substance by Infrared Spectrophotometry: Spectrum obtained was compared with RS or with the reference spectrum. Fig. 3 shows the standard IR spectra of Bupropion hydrochloride and Fig. 4 shows the IR spectra of API. Table 3 represents interpretation of IR spectra of API.
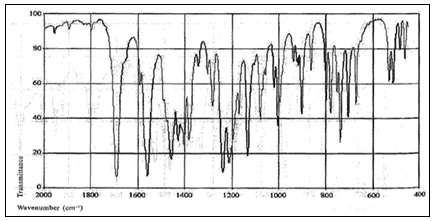
FIG. 3: IR SPECTRA OF BUP STD (I.P. 2022)
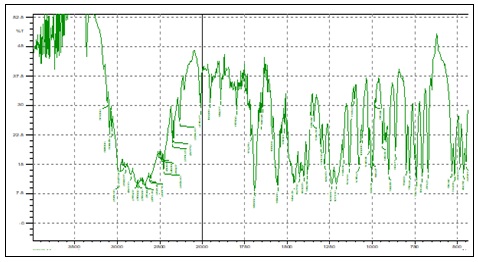
FIG. 4: IR SPECTRA OF BUP API
TABLE 3: IR INTERPRETATION
| Functional group | Frequency cm-1 |
| -C=O | 1693 |
| -NH | 3067 |
| -CN | 1134 |
Method Validation:
System Suitability: System suitability studies were performed to verify the performance and reproducibility of the developed HPTLC method. Bupropion hydrochloride produced a compact and symmetrical peak with an average Rf value of 0.37 ± 0.01. Peak area repeatability was evaluated by six replicate applications, and the %RSD of peak area was found to be less than 2.0%, indicating good precision. Peak symmetry was examined to assess chromatographic efficiency. The tailing factor was found to be 1.2, demonstrating symmetrical peak characteristics without significant peak distortion.
Reproducibility of chamber saturation conditions was evaluated by repeated chromatographic development under identical saturation conditions (15 min). The %RSD of peak area and Rf values remained below 2%, confirming satisfactory chamber saturation reproducibility.
Plate-to-plate variation was assessed using different TLC plates under identical chromatographic conditions. No significant difference in peak area or Rf values was observed, indicating good reproducibility and consistency of the method.
The obtained system suitability parameters demonstrated that the developed HPTLC method is suitable for routine analysis of bupropion hydrochloride in tablet dosage forms.
TABLE 4: SYSTEM SUITABILITY PARAMETERS
| Parameter | Result |
| Rf value | 0.37 ± 0.01 |
| Peak area repeatability (%RSD, n=6) | 1.92 |
| Peak symmetry | Symmetrical |
| Tailing factor | 1.2 |
| Chamber saturation time | 15 min |
| Chamber saturation reproducibility (%RSD) | 1.36 |
| Plate-to-plate variation (%RSD) | 1.20 |
| Peak purity correlation coefficient | 0.9996 |
Specificity/ Selectivity: The specificity of the method was determined by analysis of the test (API) and the tablet. The Rf values and spectra of BUP test (API) and tablet was compared. The method was found to be selective because the Rf value of analytes obtained in test solution was similar to that of Rf value from standard (Tablet) solution as represent in Fig. 5-7. Peak purity for BUP was assessed by comparing spectra acquired at three different position, i.e., the peak start (S), peak apex (M), and peak end (E) positions of the spot. Good correlation (r = 0.9996) was obtained between spectra from BUP API and tablet.
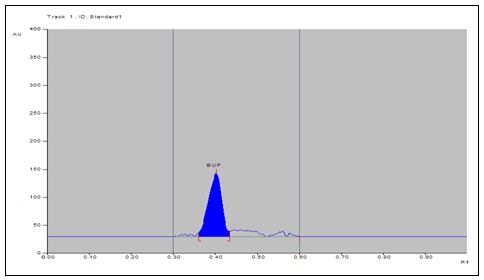
FIG. 5: HPTLC DENSITOGRAM OF STANDARD SOLUTION
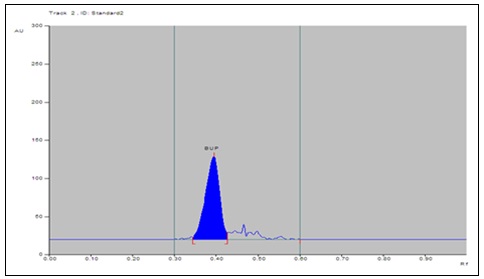
FIG. 6 HPTLC DENSITOGRAM OF TEST SOLUTION
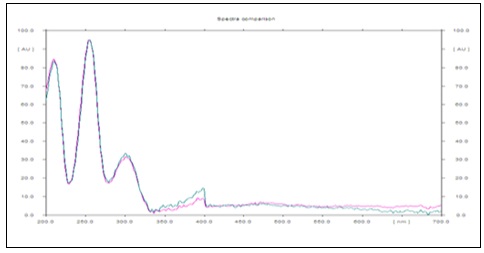
FIG. 7: COMPARISON OF ABSORBANCE SPECTRA FOR BUP API AND TABLET
Linearity: The data for linear regression analysis of calibration curve of Bupropion hydrochloride is tabulated in Table 5. The linearity for BUP was found in the range of 150-350 ng/band is shown in 3D overlay chromatogram of BUP Fig. 8 and Correlation coefficient, linearity equations (slope and intercept) are presented in Fig. 9.
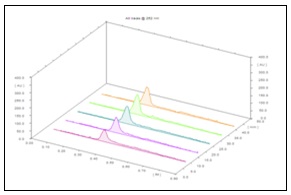
FIG. 8: 3D DISPLAY OF LINEARITY OF BUP AT 252 NM
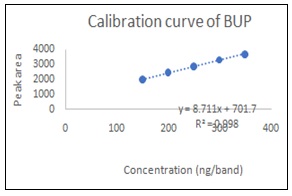
FIG. 9: CALIBRATION CURVE OF BUP
Linear regression analysis showed a good linear relationship. The coefficient of determination (R2) was recorded as 0.9984 and found to be significant. The equation for regression line was obtained as Y = 8.7112x + 701.75, in which Y represents the peak area and x is the concentration of Bupropion hydrochloride.
TABLE 5: LINEAR REGRESSION DATA FOR CALIBRATION CURVE OF BUPROPION HYDROCHLORIDE
| Linearity range (ng per spot) | 150 – 350 |
| Regression equation | Y = 8.7112x + 701.75 |
| R2 | 0.9984 |
| Slope | 8.7112 |
| Intercept | 701.75 |
| LOD | 7.36 |
| LOQ | 22.31 |
The values of slope and intercept depend on x-axis and y-axis values, respectively. The values in x-axis are the concentrations of Bupropion hydrochloride which were ranged as 150-350 ng/band. However, the values in y-axis are the measured HPTLC area of Bupropion hydrochloride which were obtained in the range of 1975-3724.
Precision: Precision of the proposed HPTLC method is expressed as the %RSD of the measured concentrations for Bupropion hydrochloride. The precision was determined as repeatability, intra-day and inter-day precision and results are tabulated in Table 6.
Repeatability was carried out by performing spot applicator repeatability and scanner repeatability. The %RSD for repeatability was obtained as 0.29% and 1.16%. However, the %RSD for intra-day precision and inter-day precision was found to be 0.65-1.33% and 1.42-1.97% respectively.
TABLE 6: PRECISION OF THE PROPOSED METHOD
| Spot applicator repeatability for BUP (n=6) | |||
| Conc. (ng/band) | Mean Peak area | Standard deviation | %RSD |
| 250 | 2941.5 | 34.08 | 1.16 |
| Scanner repeatability for BUP (n=6) | |||
| Conc. (ng/band) | Mean Peak area | Standard deviation | %RSD |
| 250 | 2951.4 | 8.56 | 0.29 |
| Intra-day precision for BUP (n=3) | |||
| Conc. (ng/band) | Mean Peak area | Standard deviation | %RSD |
| 200 | 2456.2 | 15.98 | 0.65 |
| 250 | 2853.6 | 14.10 | 0.49 |
| 300 | 3351.1 | 44.44 | 1.33 |
| Inter-day precision for BUP (n=3) | |||
| Conc. (ng/band) | Mean Peak area | Standard deviation | %RSD |
| 200 | 2460.9 | 35.07 | 1.42 |
| 250 | 2919.7 | 57.69 | 1.97 |
| 300 | 3343.9 | 62.09 | 1.86 |
Accuracy: Accuracy of the proposed HPTLC method is expressed as the % recovery. The % recovery of the Bupropion hydrochloride for the proposed analytical methodology was recorded as 99.07% - 101.85% Table 7. The %RSD for the recovery studies was obtained as 0.45 – 1.70%.
TABLE 7: ACCURACY OF THE PROPOSED METHOD (N=3)
| Level | Amount of sample (ng/band) | Amount of std. spike (ng/band) | Actual amount (ng/band) | Peak area | SD | %RSD | % Recovery |
| 0% | 150 | 0 | 150 | 1996.27 | 13.92 | 0.69 | 99.06 |
| 80% | 150 | 120 | 270 | 3051.67 | 25.54 | 0.84 | 99.91 |
| 100% | 150 | 150 | 300 | 3363.63 | 15.42 | 0.46 | 101.85 |
| 120% | 150 | 180 | 330 | 3589.7 | 61.03 | 1.70 | 100.46 |
Robustness: Robustness was carried out using 250ng/band sample solution of BUP by alteration in different parameters like, change in wavelength, change in slit dimensions, change in band length, change in mobile phase composition and change in solvent migration distance, which are shows in Table 8, 9, 10, 11 & 12.
TABLE 8: DATA OF ROBUSTNESS AT DIFFERENT WAVELENGTHS (N=3)
| Conc. of BUP (ng/band) | Wavelength (nm) | Mean peak area | SD | %RSD | Rf |
| 250 | 250 | 2954.1 | 16.52 | 0.56 | 0.38 |
| 250 | 252 | 2955.8 | 28.62 | 0.97 | 0.37 |
| 250 | 254 | 2890.1 | 55.18 | 1.91 | 0.36 |
TABLE 9: DATA OF ROBUSTNESS AT DIFFERENT SLIT DIMENSION (N=3)
| Conc. of BUP (ng/band) | Slit dimensions (mm) | Mean peak area | SD | %RSD | Rf |
| 250 | 5 x 0.20 | 2876.6 | 51.20 | 1.78 | 0.36 |
| 250 | 5 x 0.30 | 2955.8 | 28.62 | 0.97 | 0.37 |
| 250 | 5 x 0.45 | 2890.1 | 55.18 | 1.91 | 0.36 |
TABLE 10: DATA OF ROBUSTNESS AT DIFFERENT BAND LENGTH (N=3)
| Conc. of BUP (ng/band) | Band length (mm) | Mean peak area | SD | %RSD | Rf |
| 250 | 4 | 2616.7 | 17.44 | 0.67 | 0.37 |
| 250 | 5 | 2824.8 | 30.74 | 1.09 | 0.38 |
| 250 | 6 | 2955.8 | 28.62 | 0.97 | 0.37 |
TABLE 11: DATA OF ROBUSTNESS AT DIFFERENT MOBILE PHASE COMPOSITION (N=3)
| Conc. of BUP (ng/band) | Mobile phase composition (Methanol: Chloroform: Glacial acetic acid v/v/v) | Mean peak area | SD | %RSD | Rf |
| 250 | 1:9:0.3 | 2964.3 | 23.74 | 0.80 | 0.38 |
| 250 | 1.5:8.5:0.3 | 2955.8 | 28.62 | 0.97 | 0.37 |
| 250 | 2:8:0.3 | 2746.6 | 44.52 | 1.62 | 0.42 |
TABLE 12: DATA OF ROBUSTNESS AT DIFFERENT SOLVENT MIGRATION DISTANCE (N=3)
| Conc. of BUP (ng/band) | Solvent migration distance (mm) | Mean peak area | SD | %RSD | Rf |
| 250 | 76 | 2619.7 | 25.91 | 0.99 | 0.35 |
| 250 | 78 | 2852.7 | 46.87 | 1.64 | 0.36 |
| 250 | 80 | 2955.8 | 28.62 | 0.97 | 0.37 |
The Rf value for Bupropion hydrochloride after the small deliberate changes was obtained in the range of 0.35 – 0.42.
The %RSD value for small changes in wavelength, slit dimension, band length, mobile phase composition and solvent migration distance were obtained between 0.56 – 1.91%. These observations suggested that small deliberate changes into the proposed method proved the robustness of the method.
Validation of Lower Range Limits: The sensitivity of the HPTLC method was estimated in terms of LOD and LOQ. The values of LOD and LOQ are tabulated in Table 4. The LOD and LOQ of the HPTLC method were recorded as 7.36 and 22.31 ng per spot.
This observation suggested that the proposed HPTLC method has good sensitivity which could be applied in wide range for detection and quantification of bupropion hydrochloride.
Assay: The assay results are summarized in Table 13 and were found between the acceptance criteria 90% to 110%.
TABLE 13: DATA OF ASSAY (N=3)
| Formulation | Actual conc. (ng/band) | Mean peak area | SD | % RSD | % Mean recovery |
| BUPRON XL 150 | 250 | 2845.6 | 45.18 | 1.59 | 98.44 |
Greenness Assessment: The environmental impact of the developed HPTLC method was evaluated using AGREE, GAPI, NEMI and Analytical Eco-scale tools.
AGREE – Analytical Greenness Calculator:
TABLE 14: ANALYTICAL GREENNESS REPORT SHEET
| Criteria | Score | Weight |
| Direct analytical techniques should be applied to avoid sample treatment | 0.7 | 2 |
| Minimal sample size and minimal number of samples are goals | 1.0 | 2 |
| If possible, measurements should be performed in situ | 0.66 | 2 |
| Integration of analytical processes and operations saves energy and reduces the use of reagents | 1.0 | 2 |
| Automated and miniaturized methods should be selected | 0.25 | 2 |
| Derivatization should be avoided | 1.0 | 2 |
| Generation of a large volume of analytical waste should be avoided, and proper management of analytical waste should be provided | 0.39 | 2 |
| Multianalyte or multi parameter methods are preferred versus methods using one analyte at a time | 0.12 | 2 |
| The use of energy should be minimized | 1.0 | 2 |
| Reagents obtained from renewable sources should be preferred | 1.0 | 2 |
| Toxic reagents should be eliminated or replaced | 0.23 | 2 |
| Operators safety should be increased | 1.0 | 2 |
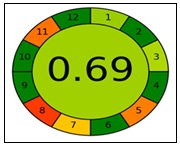
FIG. 10: ANALYTICAL GREENNESS SCORE
According to Table 14 and Fig. 10 the AGREE score obtained for the developed method was 0.69, indicating acceptable environmental performance according to the principles of green analytical chemistry.
GAPI – Green Analytical Procedure Index:
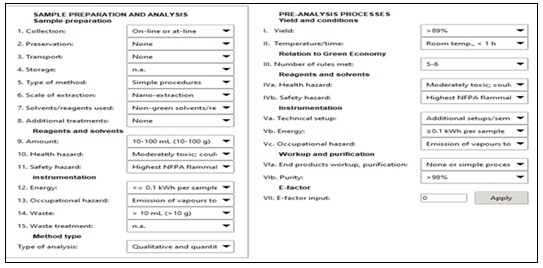
FIG. 11: GREEN ANALYTICAL PROCEDURE INDEX (GAPI)
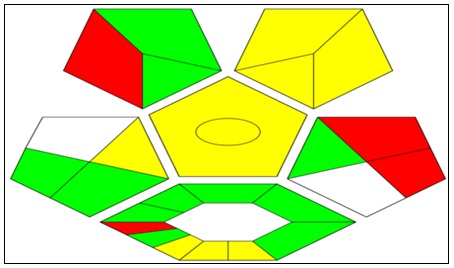
FIG. 12: GAPI PICTOGRAM FOR DETERMINING ANALYTICAL METHOD USING HPTLC
According to the Fig. 11 for GAPI index and 10 there are 8 yellow, 11 green pictograms and 4 red pictograms are obtained as per method data.
Oval in middle shows that procedure of this analytical method is for both quantitatively and qualitatively. For the health and safety hazards there is a guideline called NEPA, according to the guideline’s solvents (Methanol, Glacial acetic acid and Chloroform) have NFPA score of 2 to 3, thus for the reagent and solvents pictogram obtained was yellow. For the temperature, whole process was done at room temperature for HPTLC, thus pictogram of that particular category become green. For the technical setup of the instrument, whole method development was done on HPTLC instrument which is semi-advanced setup, thus pictogram of technical setup becomes yellow. For the amount of reagent used during the method development is 30 mL, which is come under the yellow contain limit of 10-100 mL. The GAPI pictogram exhibited predominantly green and yellow zones with limited red zones, indicating moderate environmental impact. The presence of chloroform in the mobile phase contributed to non-green characteristics in the solvent section.
Anlytical ECO Scale for Assessment (ESA):
TABLE 15: ANALYTICAL ECO SCALE ASSESSMENT
| Reagents | Total Penalty points | ||
| Amount | 2 | Amount PP * Hazard PP = 2*14 = 28 | |
| Hazard (physical, environmental, health) | 14 | ||
| Instruments | |||
| Energy | ≤0.1 kWh per sample | 0 | |
| Occupational hazard | Emission of vapours and gases to the air | 3 | |
| Waste | >10 mL (g) | 3 | |
| TOTAL PENALTY POINTS: 28 + 6 = 34. Analytical Eco-Scale = 100 - total penalty points. 100 – 34 = 66. | |||
Referring to Gałuszka et al. for convenience and simplicity, pictograms and signal words should be included in the evaluation of hazards posed by reagents used in an analytical procedure represents in Table 15. For the reagent there are 3 criteria for the reagent amount represents in Table 16.
TABLE 16: REAGENT AMOUNT
| Less than 10 mL | 1 |
| 10-100 mL | 2 |
| More than 100 mL | 3 |
According to literature review total amount of reagent used in method is 10 mL, thus penalty point should be 2 according Table 17.
TABLE 17: AMOUNT OF REAGENT
| Methanol | 1.5 |
| Chloroform | 8.5 |
| Glacial acetic acid | 0.3 |
For the reagent hazards there are 3 criteria according Table 18.
TABLE 18: REAGENT HAZARD CRITERIA
| None | 0 |
| Less severe | 1 |
| More severe | 2 |
According to literature review total penalty points of reagents calculated as 14 represents in Table 19.
TABLE 19: TOTAL PENALTY POINTS
| Methanol | 6 |
| Chloroform | 4 |
| Glacial acetic acid | 4 |
For the energy of instrument, there are 3 criteria according Table 20.
TABLE 20: ENERGY OF INSTRUMENT
| ≤ 0.1 kwh per sample | 0 |
| ≤ 1.5 kwh per sample | 1 |
| > 1.5 kwh per sample | 2 |
According to literature review, HPTLC consumes 0.1 kWh per sample energy, thus penalty point should be 0.
For the waste there are 8 criteria represents in Table 21.
TABLE 21: WASTE CRITERIA
| None | 0 |
| Less than 1 mL | 1 |
| 1-10 mL | 3 |
| More than 10 mL | 5 |
| Recycling | 0 |
| Degradation | 1 |
| Passivation | 2 |
| No treatment | 3 |
According to method there was a waste between 1 to 10 mL during method development. Thus, penalty point should be 3.
For the occupational hazards there are 2 criteria according Table 22.
TABLE 22: OCCUPATIONAL HAZARDS CRITERIA
| Analytical process hermetization | 0 |
| Emission of vapours and gases to the air | 3 |
According to method vapour generated during the method development. Thus, penalty point should be 3. The Analytical Eco-scale score was calculated after considering reagent hazards, energy consumption and waste generation. The final Eco-scale score was 66, indicating that the method can be classified as an environmentally acceptable analytical procedure.
National Environmental Method Index (NEMI): The NEMI pictogram indicated represent in Fig. 13 and 14 compliance with most environmental criteria. However, due to the use of chloroform, one quadrant remained unshaded, reflecting the hazardous nature of the solvent.
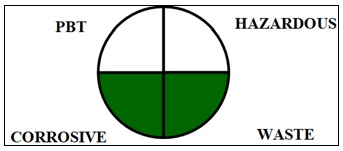
FIG. 113: NEMI PICTOGRAM SCREENING OVER THE ASSESSMENT OF A GREEN METHOD
Modified NEMI:
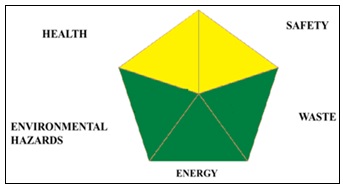
FIG. 14: MODIFIED PENTAGRAM FOR NEMI
TABLE 23: COMPARISON DATA
| Parameters | Available Method | Developed Method |
| Wavelength | 254 | 252 |
| Rf | 0.56 ± 0.01 | 0.37 |
| Linearity range | 200-1000 ng/band | 150 – 350 ng/band |
| LOD | 11.45 | 7.36 |
| LOQ | 34.71 | 22.31 |
According to Table 23 Sensitivity of developed method was good compare to the available method. Although the method incorporates chloroform as a component of the mobile phase, the low solvent consumption, short analysis time and reduced waste generation contribute to improved sustainability compared with conventional chromatographic methods. Therefore, the developed procedure may be regarded as an environmentally acceptable rather than a completely green analytical method.
Summary: The developed HPTLC method for BUP was validated as per guideline ICH Q2 (R1). The mobile phase was consisting of Methanol: Chloroform: Glacial acetic acid (1.5:8.5:0.3 v/v/v). The method showed confirmed linearity over the selected linearity range i.e., 150-350 ng/band for BUP. The method has been proven precise enough with %RSD less than 2.0 % during intra- day and inter-day precision. The method was also able to recover analyte from marketed formulation and recovery ranges were found to be 101.85% for BUP. The summary of validation study was shown in Table 24.
TABLE 24: SUMMARY OF VALIDATION PARAMETERS FOR HPTLC METHOD
| Sr. no. | Validation Parameters | BUP | |
| 1. | Specificity | Specific | |
| 2. | Linearity (ng/band) (n=5) | 150-350 | |
| 3. | LOD (ng/band) | 7.36 | |
| 4. | LOQ (ng/band) | 22.31 | |
| 5. | Accuracy (%) (n=3) | 99.07% - 101.85% | |
| 6. | Precision (%RSD) | Applicator repeatability | 1.16 |
| Scanner repeatability | 0.29 | ||
| Intra-day precision (n=3) | 0.48 – 1.34 | ||
| Inter-day precision (n=3) | 1.41 – 1.98 | ||
| 7. | Robustness | Change in wavelength (n=3) | 0.55 – 1.92 |
| Change in slit dimension (n=3) | 0.96 – 1.92 | ||
| Change in band length (n=3) | 0.66 – 1.10 | ||
| Change in mobile phase composition (n=3) | 0.79 – 1.63 | ||
| Change in solvent migration distance (n=3) | 0.96 – 1.65 | ||
CONCLUSION: Although HPTLC methods for Bupropion hydrochloride have been reported, the present method offers a simple and cost-effective approach with low solvent consumption and rapid analysis. The greenness profile was evaluated using AGREE, GAPI, NEMI and Analytical Eco-scale metrics, providing a comprehensive assessment of environmental sustainability. The developed method can therefore be considered suitable for routine quality control analysis.
ACKNOWLEDGEMENTS: The authors would like to extend their sincere appreciation to the Department of Pharmaceutical Sciences, Sardar Patel University for carrying out this research work.
CONFLICTS OF INTEREST: Nil
REFERENCES:
- Kumar KS, Srivastava S, Paswan S and Dutta AS: Depression-symptoms, causes, medications and therapies. The Pharma Innovation 2012; 1(3): 37.
- Mayo Clinic, https://www.mayoclinic.org/diseases-conditions/depression (Access date: 21/04/2024 Time: 11:00 AM).
- Cleveland Clinic, https://my.clevelandclinic.org/health/diseases/9290 (Access date: 21/04/2024 Time: 10:30 AM).
- Foley KF, DeSanty KP and Kast RE: Bupropion: pharmacology and therapeutic applications. Expert Review of Neurotherapeutics 2006; 6(9): 1249-65.
- Niemegeers P, Dumont GJ, Patteet L, Neels H and Sabbe BG: Bupropion for the treatment of seasonal affective disorder. Expert Opinion on Drug Metabolism & Toxicology 2013; 9(9): 1229-40.
- Yeniceli D and Dogrukal AK: The determination of Bupropion hydrochloride in pharmaceutical dosage forms by original UV and second derivative UVspectrophotometry, potentiometric and conductometric methods. Turkish Journal of Pharmaceutical Science 2010; 7: 99-110.
- Bhardwaj H, Goyal R, Agarwal D, Sharma AK, Khandelwal M and Aman S: Method development and validation process of Bupropion (a novel antidepressant drug) by RP-HPLC (reverse phase high performance liquid chromatography). World Journal of Pharmaceutical Research 2021; 10(3): 1763-1771.
- Pingale B and Tiwari R: Development and Validation of an RP-HPLC Method for the Estimation of Bupropion hydrochloride. Research Journal of Pharmacy and Technology 2011; 4(9): 1480-2.
- Ramnadh B and Vikas CH: Simultaneous estimation of Naltrexone and Bupropion in pharmaceutical dosage form by using UV spectroscopy. World Journal of Biology Pharmacy and Health Sciences 2020; 1(1): 033-41.
- Haritha A, Kumar PB, Priya RV and Sekhar KC: Analytical method development and validation for simultaneous estimation of Naltrexone hydrochloride and Bupropion hydrochloride in oral dosage form (tablets) by RP-HPLC techniques. J. Global Trends Pharmaceutical Sciences 2015; 6(2): 2600-6.
- Tulasi A: Method development and validation of RP-HPLC for simultaneous estimation of Bupropion and Zonisamide. World Journal of Pharmaceutical Sciences 2023; 1-8.
- Thakar DS and Varghese A: Bioanalytical method development and validation of Bupropion hydrochloride in rat plasma by RP, HPLC. International Journal of Pharmaceutical Bioscience and Technology 2013; 1: 20-6.
- Apostolidi A, Protopapa C, Siamidi A, Vlachou M and Dotsikas Y: Dissolution assay of Bupropion/Naltrexone hydrochloride salts of bilayer composition tablets following the development and validation of a novel HPLC method. Materials 2022; 15(23): 8451.
- Cha KH, Lee NY, Kim MS, Kim JS, Park HJ, Park JS, Cho WK and Hwang SJ: Development and optimization of a novel sustained-release tablet formulation for Bupropion hydrochloride using Box-Behnken design. Journal of Pharmaceutical Investigation 2010; 40(5): 313-9.
- Kumar A, Agarwal D and Bansal M: Method Development and Validation of A Novel Anti-Depressant Bupropion by RP-HPLC. Asian Journal of Pharmaceutical Research and Development 2020; 8(3): 211-24.
- Abbas SS, Elghobashy MR, Shokry RF and Bebawy LI: Stability indicating HPLC and spectrophotometric methods for the determination of bupropion hydrochloride in the presence of its alkaline degradates and related impurity. Bulletin of Faculty of Pharmacy, Cairo University 2012; 50(1): 49-59.
- Shah PA, Parekh JM and Shrivastav PS: Assessment of critical extraction and chromatographic parameters for the determination of Bupropion and its three primary metabolites in human plasma by LC-MS/MS. Microchemical Journal 2017; 135: 81-90.
- Yeniceli D and Dogrukol-Ak D: A validated thin-layer chromatographic method for analysis of Bupropion hydrochloride in a pharmaceutical dosage form. JPC–J of Planar Chromatography–Modern TLC 2010; 23: 212-8.
- Development and Validation of HPTLC method for Simultaneous estimation of Aspirin and Esomeprazole magnesium in synthetic mixture, BA Patel, SJ Parmar, JA Doshi, AD Captain. Int J for Pharmaceutical Research Scholars 2014; (1): 236-242. ISSN No: 2277 – 7873.
- Jonsee Rajeshbhai Tilala, M. Pharm (Pharmaceutical Quality Assurance) Thesis, “Development and Validation of Spectroscopic and Chromatograpic methods for Quantificaton of Vericiguat in API and tablet dosage form” Department of Pharmaceutical Sciences, Sardar Patel University 2023.
- Indian Pharmacopoeia (2022), Volume 1 Pg: 532, Volume 2 Pg: 1690-1694. (Access date: 20/12/2023 Time: 10:30 AM)
- United States Pharmacopoeia (2023). https://doi.org/10.31003/USPNF_M10524_10_01 9 April 2023, (Access date: 20/12/2023 Time: 11:30 AM).
- Pena-Pereira F, Wojnowski W and Tobiszewski M: AGREE - Analytical GREEnness metric approach and software. Analytical Chemistry 2020; 92(14): 10076-82.
- Płotka-Wasylka J and Wojnowski W: Complementary green analytical procedure index (ComplexGAPI) and software. Green Chemistry 2021; 23(21); 8657-65.
- Płotka-Wasylka J: A new tool for the evaluation of the analytical procedure: Green Analytical Procedure Index. Talanta 2018; 181: 204-9.
- Gałuszka A, Migaszewski ZM, Konieczka P and Namieśnik J: Analytical Eco-Scale for assessing the greenness of analytical procedures. TrAC Trends in Analytical Chemistry 2012; 37: 61-72.
- de la Guardia M and Garrigues S: Handbook of green analytical chemistry. Editors Chichester John Wiley & Sons 2012.
- Armenta S, Garrigues S and de la Guardia M: Green analytical chemistry. TrAC Trends in Analytical Chemistry 2008; 27(6): 497-511.
- United State Environmental Protection Agency, (Access date: 20/04/2024 Time: 11:30 AM).
How to cite this article:
Rohit AH, Patel BA and Patel F: Green analytical approach for development and validation of an HPTLC method for quantification of bupropion hydrochloride in tablet dosage form and its greenness assessment. Int J Pharm Sci & Res 2026; 17(10): 3045-57. doi: 10.13040/IJPSR.0975-8232.17(10).3045-57.
All © 2026 are reserved by International Journal of Pharmaceutical Sciences and Research. This Journal licensed under a Creative Commons Attribution-NonCommercial-ShareAlike 3.0 Unported License.
Article Information
18
3045-3057
3608 KB
5
English
IJPSR
Amisha H. Rohit, Bhavna A. Patel and Falguni Patel *
Department of Pharmaceutical Sciences, Sardar Patel University, Vallabh Vidyanagar, Gujarat, India.
falguni.patel1205@gmail.com
07 June 2026
19 June 2026
08 July 2026
10.13040/IJPSR.0975-8232.17(10).3045-57
01 October 2026
 Download