




INVESTIGATION OF GREEN UV SPECTROPHOTOMETRIC TECHNIQUES FOR SIMULTANEOUS ESTIMATION OF SELECTED FIXED-DOSE COMBINATION
HTML Full TextINVESTIGATION OF GREEN UV SPECTROPHOTOMETRIC TECHNIQUES FOR SIMULTANEOUS ESTIMATION OF SELECTED FIXED-DOSE COMBINATION
C. Kumbharjuvekar *, V. Gaonkar, A. Naik and S. Kudchadkar
Department of Pharmaceutical Quality Assurance, Goa College of Pharmacy, Panaji, Goa, India.
ABSTRACT: The binary mixture of Linagliptin (LINA) with Empagliflozin (EMPA) in fixed dose combination was selected with the aim to develop and rigorously validate simple yet reliable UV spectrophotometric methods which are specific, precise and accurate for their simultaneous quantification. Two UV spectrophotometric methods, namely Ratio Subtraction and Extended Ratio Subtraction (RS-ERS) and Ratio Subtraction Coupled with Constant Multiplication (RS-CM) methods, were developed. In RS-ERS, LINA and EMPA were accurately determined at 294 nm and 273 nm, respectively, taking divisor concentrations of 10 µg/mL for LINA and 20 µg/mL for EMPA. The linearity found to be in the range of 6-14 µg/mL for LINA and 12-28 µg/mL for EMPA with regression equations y = 0.0435x – 0.0137 (r2 = 0.9994) and y = 0.0026x + 0.0087 (r2 = 0.9997) respectively. Precision studies demonstrated satisfactory repeatability with% RSD values ranging from 1.12 – 1.96%. Accuracy assessed by recovery studies at 80%, 100%, and 120% levels showed recoveries of 100.19 – 101.33% for RS-ERS and 99.94-101.59% for RS-CM. Assay results for the marketed formulation were within pharmacopeial limits, ranging from 98.73-101.43% of the label claim. Robustness studies involving deliberate variations in wavelength, divisor conc. and constant region selection showed %RSD values below 2%, indicating the reliability of the methods. Greenness assessment using AGREE and ComplexGAPI tools yielded an AGREE score of 0.82 and an E-factor of 0.2, indicating favourable environmental characteristics. The developed methods were validated as per ICH Q2(R2) guidelines and were found to be accurate, precise, robust, economical and suitable for routine quality control analysis of Linagliptin and Empagliflozin in combined dosage forms.
Keywords: Spectrophotometry, Linagliptin, Empagliflozin, RS-ERS, RS-CM, ICH Q2 (R2) guidelines, Greenness
INTRODUCTION: Linagliptin (C25H28N8O2) is a xanthine with a crystalline white to yellowish solid appearance and the IUPAC name 8-[(3R)-3-aminopiperidin-1-yl]-7-but-2-ynyl-3-methyl-1-[(4-methylquinazolin-2-yl) methyl] purine-2,6-dione.
It is used for the treatment of type II diabetes mellitus. It acts as a hypoglycemic agent and a dipeptidyl-peptidase IV inhibitor. It is a member of quinazolines and an aminopiperidine derivative 1-3.
Empagliflozin (C23H27ClO7) is a C-glycosyl compound consisting of a beta-glucosyl residue having IUPAC name (2S,3R,4R,5S,6R)-2-[4-chloro-3-[[4-[(3S)-oxolan-3-yl] oxyphenyl] methyl] phenyl]-6-(hydroxymethyl) oxane-3,4,5-triol. A sodium-glucose co-transporter 2 inhibitor used as an adjunct to diet and exercise to improve glycemic control in adults with type 2 diabetes mellitus.
It has a role as a hypoglycemic agent and a sodium-glucose transport protein subtype 2 inhibitor. It is a C-glycosyl compound, an aromatic ether, a tetrahydrofuryl ether and a member of monochlorobenzenes 4-5.
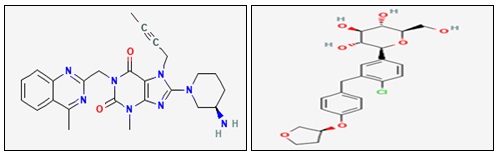
FIG. 1: MOLECULAR STRUCTURE OF (A) LINAGLIPTIN AND (B) EMPAGLIFLOZIN
A thorough literature review was done from different sources such as Google Scholar, PubMed and scientific journals. The investigation revealed various analytical methods such UV 6-10, RP-HPLC 11-16, HPLC 17-19 have been reported for individual estimation of LINA and EMPA as well as their combination. However, no RS-ERS and RS-CM methods were reported for simultaneous quantification of Linagliptin and Empagliflozin. Several UV spectrophotometric and chemometric methods have been reported for the simultaneous estimation of LINA and EMPA. However, no reports describing the application of RS-ERS and RS-CM methods for this combination were found in the literature. Compared with chemometric approaches, the proposed methods require simpler mathematical manipulation, do not require specialized software, and are more suitable for routine quality control laboratories. Therefore, the present study was undertaken to develop and validate RS-ERS and RS-CM methods for simultaneous estimation of LINA and EMPA in accordance with ICH Q2(R2) guidelines along with greenness assessment.
MATERIAL AND METHOD:
Instrumentation: The spectrophotometric analysis was done using a UV-Visible double beam spectrophotometer (make SHIMADZU, model UV-2700) equipped with a pair of 1 cm matched quartz cells (spectral bandwidth of 1 nm, scan speed of 400 nm/min and data interval 0f 0.5nm). All weighing procedures were performed on Wensar electronic balance (model MAB 220) and calibrated glassware was used consistently throughout the study. Baseline correction was performed using solvent blank prior to each scan.
Reagents and Chemicals: Pure drug samples of Linagliptin and Empagliflozin were generously provided by Bajaj Healthcare Limited, Manjusar, Ta. Savali, Vadodara and Exemed Pharmaceuticals, Dist.: Valsad, Gujarat, India respectively. Methanol HPLC grade and Distilled water were used as solvents throughout the study.
Marketed Formulation: The commercial formulation, Empacrux-L (each tablet contains Empagliflozin 10mg and Linagliptin 5mg). Manufactured by Logos Pharma, Village Maissa Tibba, Tehsil Nalagarh, District Solan (H.P.).
Preparation of Solutions:
Preparation of Standard Stock Solution of LINA (1000 µg/mL): An accurately weighed 100 mg of LINA was transferred into a 100 mL volumetric flask. To ensure complete dissolution, 50 mL of methanol was added initially. The solution was then diluted up to the mark by adding methanol to get a standard stock solution with a concentration of 1000 µg/mL.
Preparation of Working Standard Solution of LINA (100 µg/mL): A 10 mL aliquot of the standard stock solution of LINA was precisely transferred into 100 mL volumetric flask. To ensure uniform mixing, 50 mL of methanol was added initially. The solution was then diluted to volume with the same solvent to prepare a working standard solution with a concentration of 100 µg/mL.
Preparation of Standard Stock Solution of EMPA (1000 µg/mL): An accurately weighed 100 mg of EMPA was transferred into a 100 mL volumetric flask. To ensure complete dissolution, 50 mL of methanol was added initially. The solution was then diluted up to the mark by adding methanol to get a standard stock solution with a concentration of 1000 µg/mL.
Preparation of Working Standard Solution of EMPA (100 µg/mL): A 10 mL aliquot of the standard stock solution of EMPA was precisely transferred into 100 mL volumetric flask.
To ensure uniform mixing, 50 mL of methanol was added initially. The solution was then diluted to volume with the same solvent mixture to prepare a working standard solution with a concentration of 100 µg/mL.
Preparation of Sample Solution for Analysis: Twenty tablets were weighed and powdered. An amount equivalent to one tablet containing 5 mg of LINA and 10 mg of EMPA was transferred to a 100 mL volumetric flask and extracted with methanol.
The resulting stock solution contained 50 µg/mL of LINA and 100 µg/mL of EMPA. Subsequently, 2 mL of this solution was transferred into a 10 mL volumetric flask and diluted to volume to obtain final concentrations of 10 µg/mL of LINA and 20 µg/mL of EMPA, which were used for validation and assay studies.
Note: Methanol was used only for preparation of stock and working standard solutions as well as tablet extraction to ensure complete dissolution of the analytes. Appropriate aliquots of these solutions were subsequently diluted with distilled water to the required analytical concentrations, and all spectral measurements, calibration studies, validation experiments and method development were performed in distilled water for both the drugs.
Method Development for Simultaneous Estimation of Linagliptin and Empagliflozinin Distilled Water:
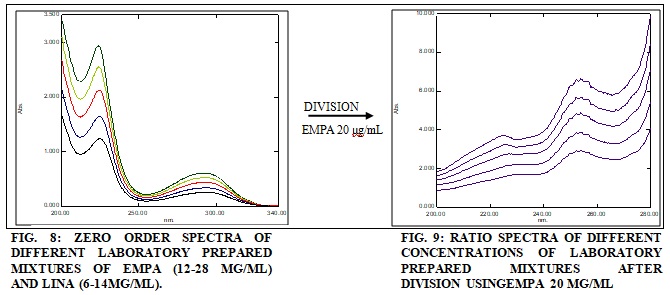
Ratio Subtraction and Extended Ratio Subtraction Method (Rs-Ers) 19-22: The RS-ERS method is used for the simultaneous determination of drugs present in a binary mixture with extended spectra. In the selected combination of LINA and EMPA, LINA exhibited a more extended spectrum than EMPA. The λmax of LINA and EMPA in distilled water was found to be 294nm and 273nm respectively.
Step 1:
(EMPA + LINA) / LINA = EMPA / LINA + LINA / LINA = EMPA / LINA + CONSTANT
The plateau region of the resulting spectrum, where the contribution from X is negligible, is used to measure the constant value LINA/LINA'
Step 2:
EMPA / LINA + CONSTANT - CONSTANT = EMPA / LINA
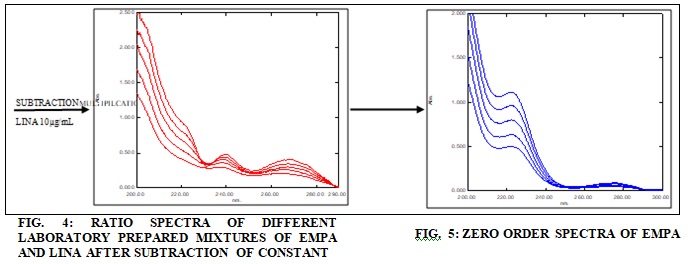
This constant is subtracted from the entire ratio spectrum, and the resulting curve is then multiplied by the divisor LINA'. This operation reconstructs the original zero-order absorption spectrum of EMPA, free from interference by LINA
Step 3:
EMPA / LINA × LINA = EMPA
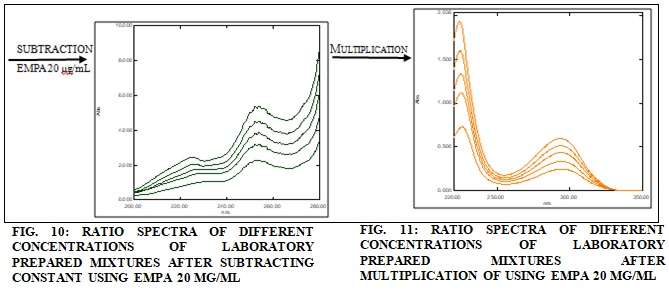
In the second method Extended Ratio Subtraction, the extended drug is determined that is LINA wherein, from the ratio subtraction method obtained EMPA drug spectra is taken and divided by the best divisor of EMPA component (EMPA’). A plateau region is obtained from which a constant value is determined. Then the original mixture spectra are taken and again divided by the best divisor (EMPA’) giving a new curve. This new curve is then subtracted with the previously obtained constant value to get other new spectra. This newly obtained spectra are then multiplied with EMPA’ to get the extended drug (LINA).
Step 1:
EMPA / EMPA' = CONSTANT
Step 2:
(EMPA + LINA) / EMPA' = EMPA / EMPA' + LINA / EMPA' = LINA / EMPA' + CONSTANT
Step 3:
LINA / EMPA' + CONSTANT-CONSTANT = LINA/EMPA'
Step 4:
LINA / EMPA' × EMPA' = LINA
Determination of EMPA by Rs Method:
Division:
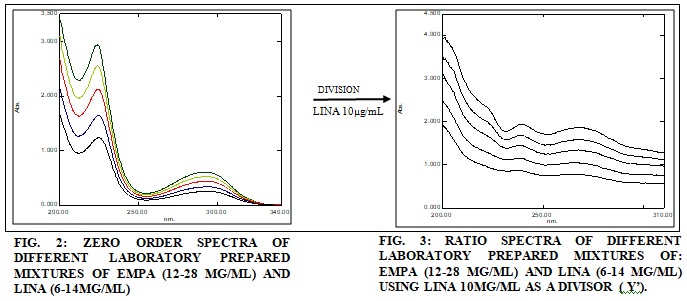
Subtraction of Constant and Multiplication:
Determination of LINA by ERS Method:
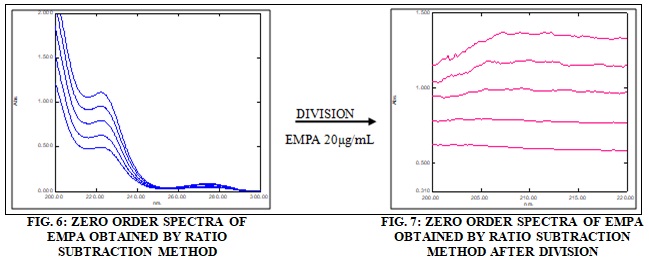
Division:
Constant Subtraction and Multiplication:
Note* - the divisor concentrations were optimized by evaluating several conc. and comparing the resulting ratio spectra with respect to spectral smoothness, signal-to-noise ratio, plateau stability and correlation coefficient values. Based on these criteria, 10 µg/mL of LINA and 20 µg/mL of EMPA were selected as the optimum divisor concentrations.
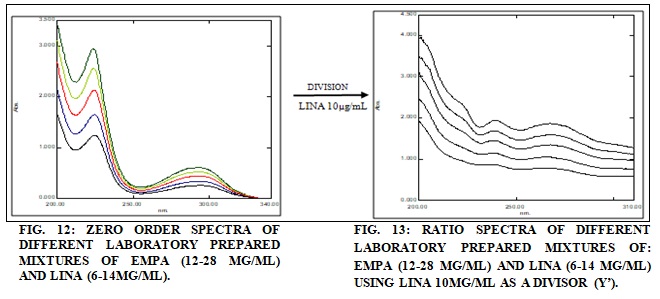
Ratio Subtraction Coupled with Constant Multiplication Method (RS-CM) 20-23: The laboratory mixtures were scanned from 200-400 nm and stored in the computer. The stored laboratory mixtures were divided by 10 μg/mL of LINA as a divisor conc. that resulted in ratio spectra which can be represented as (EMPA/LINA’) + constant. The constant value from the ratio spectra was determined in the plateau region 300-310 nm and multiplied by 10 μg/mL of LINA as a divisor conc. to obtain the original spectra of LINA. Then, the obtained original spectrum of LINA was subtracted from the stored laboratory mixtures to get the original spectra of EMPA. This can be summarised by following equation
Step 1:
(EMPA + LINA) / LINA = EMPA / LINA + LINA / LINA = EMPA / LINA + CONSTANT
Step 2:
CONSTANT x LINA = LINA
Step 3:
EMPA + LINA - LINA = EMPA
Division:
Multiplication of Constant:
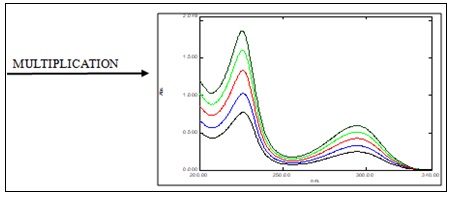
FIG. 14: ZERO-ORDER SPECTRA OF DIFFERENT CONC. OF LINA (6-14 ΜG/ML) OBTAINED AFTER MULTIPLICATION OF CONSTANT VALUE USING LINA (10ΜG/ML) AS A DIVISOR
Subtraction:
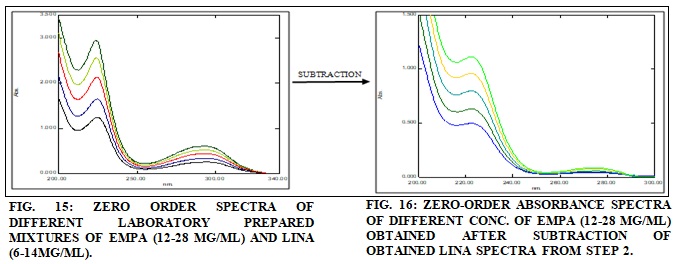
Specificity Study: Specificity of the developed methods was evaluated by comparing the spectral characteristics and assay results obtained from laboratory-prepared mixture of LINA and EMPA (1:2) and tablet extract solutions containing LINA and EMPA in the same concentration ratio (1:2). The close agreement between the obtained results and the absence of additional spectral features indicated that common tablet excipients did not significantly interfere with the determination of either analyte under the selected analytical conditions. The laboratory mixture was prepared by accurately pipetting 1 mL of LINA (100 µg/mL) and 2 mL of EMPA (100 µg/mL) into a 10 mL volumetric flask and diluting to volume with distilled water which gives conc. of 10 µg/mL of LINA and 20 µg/mL of EMPA.
To prepare the sample from the tablet formulation, 20 EMPACRUX – L tablets (total weight: 3.86 g) were powdered, and an amount equivalent to a single tablet (0.193 g, containing 5 mg LINA and 10 mg EMPA) was transferred to a 100 mL volumetric flask. Methanol (50 mL) was added, and the mixture was sonicated for 20 minutes for extraction, then diluted to volume with methanol, yielding a solution containing 50 µg/mL LINA and 100 µg/mL EMPA. Subsequently, 2 mL of this solution was transferred into a 10 mL volumetric flask and diluted to volume to obtain final concentrations of 10 µg/mL of LINA and 20 µg/mL of EMPA.
No significant differences observed between laboratory mixture and tablet extract.
Linearity and Range Study: Linearity for LINA and EMPA were evaluated over the concentration ranges of 6–14 µg/mL and 12–28 µg/mL, respectively. For LINA, five concentrations (6, 8, 10, 12 and 14 µg/mL) were prepared by pipetting 0.6–1.4 mL aliquots from a 100 µg/mL working standard into 10 mL volumetric flasks, followed by dilution with solvent.
Similarly, for EMPA, concentrations of 12, 16, 20, 24, and 28 µg/mL were prepared by pipetting 1.2–2.8 mL from a 100 µg/mL working solution (1:2). Spectra were recorded in the 200–400 nm range using a UV-Vis spectrophotometer. For RS-ERS and RS-SS absorbance of zero-order spectra were measured at 294 nm (LINA) and 273 nm (EMPA), and calibration curves (absorbance vs. concentration) were plotted to obtain regression equations.
Precision Study: Precision was evaluated at the assay concentration level using LINA (10 µg/mL) and EMPA (20 µg/mL) for both intra-day and inter-day studies.
Twenty EMPACRUX – L tablets were powdered, and a quantity equivalent to one tablet (0.193 g, containing 5 mg LINA and 10 mg EMPA (1:2)) was transferred into a 100 mL volumetric flask. To this, 50mL methanol was added, and the mixture was sonicated for 20 minutes to facilitate drug extraction.
The volume was then adjusted to 100mL with methanol, resulting in a stock solution containing 50 µg/mL LINA and 100 µg/mL EMPA. This solution was centrifuged at 3800 rpm (~1600 x g) for 30 minutes and the supernatant was carefully collected by filtering using Whatman filter paper grade 1. Suitable aliquots of the supernatant were then transferred into a 10 mL volumetric flask and diluted with the chosen solvent to obtain final assay concentrations of LINA (10 µg/mL) and EMPA (20 µg/mL) (1:2). The resulting solutions were scanned using a UV-Visible spectrophotometer across the wavelength range of 200–400 nm. Spectral data were recorded and precision was assessed as follows:
RS-ERS Method: EMPA was quantified at 273nm using 10 µg/mL LINA as the divisor; LINA was determined by using 20µg/mL EMPA and absorbance measurements were specifically recorded at 294 nm.
RS-CM: EMPA absorbance was measured at 273 nm and LINA at 294 nm, without interference. Each analysis was performed in six replicates, and the % RSD was calculated to assess method precision.
Accuracy Study: Accuracy was assessed using the standard addition method at three concentration levels - 80%, 100%, and 120% relative to the assay concentrations (10 µg/mL LINA and 20 µg/mL EMPA (1:2)).
Percent recovery was determined for each level to evaluate method accuracy. Procedure followed is same as that of Precision studies up to the preparation of tablet extract stock solution.
From this 1.2 mL was withdrawn to obtain a base concentration of LINA (6 µg/mL) and EMPA (12 µg/mL), which was then analysed using RS-ERS and RS-CM methods. To prepare 80%, 100%, and 120% assay levels, standard additions of 0.48, 0.6, and 0.72 mL for LINA and 0.96, 1.2, and 1.44 mL for EMPA (from their respective 100 µg/mL working standards) were added to the base solution. All prepared solutions were scanned in the range of 200–400 nm using a UV – Visible spectrophotometer.
RS-ERS Method: EMPA was quantified at 273nm using 10 µg/mL LINA as the divisor; LINA was determined by using 20 µg/mL EMPA and absorbance measurements were specifically recorded at 294 nm.
RS-CM: EMPA absorbance was measured at 273 nm and LINA at 294 nm, without interference. Each analysis was performed in six replicates, and the % RSD was calculated to assess method precision.
Assay: The assay of LINA and EMPA in the marketed formulation (EMPACRUX – L)(1:2) was carried out to determine the percent label claim.
RS-ERS Method:
- EMPA was determined at 273nm using 10 µg/mL LINA as the divisor.
- LINA was determined at 294 nm by Extended Ratio Subtraction method.
RS-CM:
- EMPA was quantified by measuring absorbance at 273 nm.
- LINA was quantified at 294 nm
All measurements were performed in triplicate, and the %RSD was calculated to assess the precision of the assay.
Robustness Study: Robustness of the developed RS-ERS method was evaluated by introducing small deliberate variations in analytical wavelength (294 ± 2 nm) and divisor concentrations (LINA: 10 ± 2 μg/mL and EMPA: 20 ± 4 μg/mL). The assay results showed no significant variation, and the %RSD values were found to be less than 2%, indicating that the method is robust.
Robustness of the developed RS-CM method was assessed by varying the analytical wavelength (294 ± 2 nm), divisor concentration (10 ± 2 μg/mL), and constant region selection (300–310 nm). The obtained results were not significantly affected by these changes, and the %RSD values remained below 2%, confirming the robustness of the method.
RESULTS AND DISCUSSION:
Selection of Solvent System: In order to determine a suitable solvent for the preparation of solutions of LINA and EMPA, Certificate of Analysis (COA) were referred respectively to avail information pertaining to selection of the solvent. For LINA as well as EMPA, methanol and distilled water were preferred as a solvent for solubility under respective analytical studies after referring to COA.
Since water is considered a greener and more environmentally friendly solvent than methanol thus ensuring sustainability, therefore it was decided to use distilled water as a solvent of choice for development of UV-spectrophotometric methods.
The overlain spectra of LINA (10 μg/mL) and EMPA (10 μg/mL) prepared using water is depicted in during method development using UV – Visible spectroscopy, LINA was found to exhibit maximum absorbance at a wavelength of 294 nm, while EMPA showed its maximum absorption at 273 nm.
To evaluate the accuracy of the analytical approach, comparative percent recovery data for both drugs that is LINA and EMPA using two distinct methods: Ratio subtraction coupled with Extended Ratio Subtraction (RS-ERS) and Ratio Subtraction coupled with Constant Multiplication (RS-CM).
These techniques were applied to assess the accuracy and precision of quantifying LINA and EMPA in combined formulations.
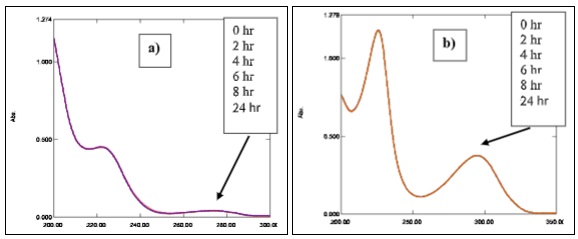
FIG. 17: ZERO-ORDER SPECTRA OF (A) EMPA AND (B) LINA IN DISTILLED WATER RECORDED AT 0, 2, 4, 6, 8 AND 24HR
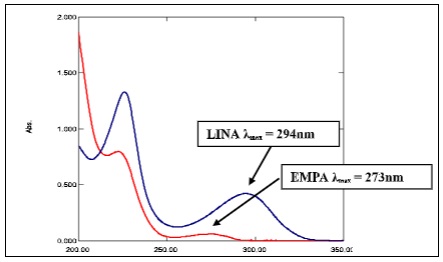
FIG. 18: OVERLAIN SPECTRA OF LINA AND EMPA WITH THEIR ABSORPTION MAXIMA
Specificity: Specificity of both the analytical method was evaluated by comparing the UV spectra of the laboratory – prepared mixture with those of the tablet formulation. The observed overlapping spectra confirmed no interference from excipients present in tablet, thereby confirming the method’s specificity for their determination of LINA and EMPA. The correspond results are illustrated in the figure below
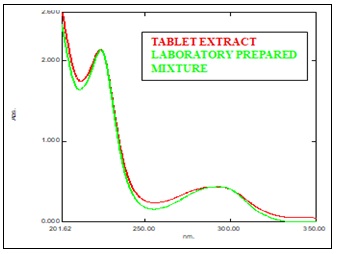
FIG. 19: OVERLAIN SPECTRA OF LABORATORY PREPARED MIXTURE AND TABLET FORMULATION OF LINA (10 µG/ML) AND EMPA (20 µG/ML) FOR RS-ERS AND RS-CM METHOD (1:2)
TABLE 1: ASSAY COMPARISON OF TABLET EXTRACT AND LABORATORY MIXTURE
| Drug | Sample | Wavelength (nm) | Label claim (μg/mL) | Found (μg/mL) | %Label claim |
| LINA | Laboratory mixture | 294 | 10 | 10.11 | 101.10 |
| EMPA | Laboratory mixture | 273 | 20 | 20.32 | 101.60 |
| LINA | Tablet extract | 294 | 10 | 10.06 | 100.60 |
| EMPA | Tablet extract | 273 | 20 | 20.33 | 101.65 |
Note: The assay limit as per IP for Linagliptin is NLT 98 % and NMT 102 % than of the stated amount and for Empagliflozin is NLT 98 % and NMT 102 % than the stated amount.
A placebo interference study could not be performed because placebo formulation containing the exact excipient composition was not available. However, specificity was assessed by comparing laboratory-prepared mixtures and tablet extract solutions at equivalent concentrations. Comparable assay values and spectral profiles were obtained, indicating no significant interference from formulation excipients.
Optimization of Divisor Concentration: Different concentrations of Linagliptin (8,10 and 12 μg/mL) and Empagliflozin (16, 20 and 24 μg/mL) were evaluated as divisor spectra during method development. The selection of the optimal divisor was based on obtaining smooth ratio spectra, minimum spectral noise, stable plateau regions and satisfactory correlation coefficients. Among the investigated concentrations, 10 µg/mL of LINA and 20 µg/mL of EMPA produced the most suitable ratio spectra with well-defined plateau regions and superior signal-to-noise characteristics. Therefore, these concentrations were selected as the optimum divisors for subsequent analysis.
TABLE 2: OPTIMIZATION AND SELECTION OF DIVISOR CONCENTRATIONS FOR RS-ERS AND RS-CM
| Divisor drug | Divisor conc. (μg/mL) | Observation | Correlation coefficient (r2) |
| LINA | 8 | Increased spectral noise | 0.9991 |
| LINA | 10 | Smooth spectra, stable plateau | 0.9994 |
| LINA | 12 | Reduced sensitivity | 0.9992 |
| EMPA | 16 | Less stable plateau | 0.9991 |
| EMPA | 20 | Smooth spectra, stable plateau | 0.9997 |
| EMPA | 24 | Reduced spectral resolution | 0.9991 |
Linearity and Calibration Curve: Five different conc. were prepared in the conc. range 6 - 14 μg/mL for LINA and 12-28 μg/mL for EMPA in triplicates from the working standard solution of 100 μg/mL of LINA and EMPA respectively after suitable dilutions. The absorbance of zero-order absorption spectra of EMPA was measured at 273 nm and for LINA it was measured at 294 nm for RS-ERS, RS-CM, methods. Two calibration curves correlating the absorbances at 273 nm and 294 nm for EMPA and LINA, respectively and the corresponding drug conc. were constructed and the regression equations were computed.
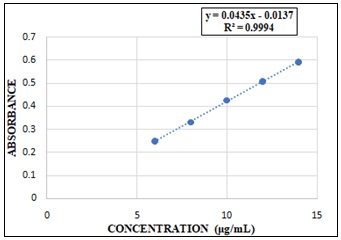
FIG. 20: CALIBRATION CURVE OF LINA (RS-ERS AND RS-CM)
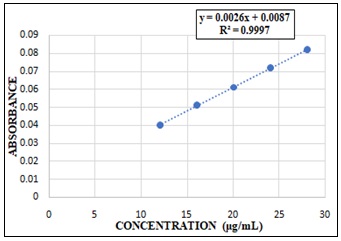
FIG. 21: CALIBRATION CURVE OF EMPA (RS-ERS AND RS-CM)
TABLE 3: LINEARITY STUDY OF LINA AND EMPA IN DISTILLED WATER
| Parameter | LINA | EMPA |
| Range (µg/mL) | 6-14 µg/mL | 12-28 µg/mL |
| Wavelength (nm) | 294 nm | 273 nm |
| Correlation coefficient (r2) | 0.9994 | 0.9997 |
| Slope | 0.0435 | 0.0026 |
| Intercept | -0.0137 | 0.0087 |
Limit of Detection (LOD) and Limit of Quantification (LOQ): LOD AND LOQ were estimated in accordance with ICH Q2(R2) guidelines using the standard deviation of the response (σ) and the slope (S) of the calibration curve. LOD and LOQ were calculated using the following equations:
LOD = (3.3σ) / S
LOQ = 10σ / S
For LINA, the calculated LOD and LOQ were found to be 0.197 µg/mL and 0.598 µg/mL, respectively. For EMPA, the calculated LOD and LOQ were found to be 1.78 µg/mL and 5.38 µg/mL, respectively. The low LOD and LOQ values indicate adequate sensitivity of the developed RS-ERS and RS-CM methods for the determination of LINA and EMPA.
Range: The analytical range was established as 6-14 µg/mL for LINA and 12-28 µg/mL for EMPA. Within these conc. ranges, acceptable linearity, accuracy and precision were demonstrated in accordance with ICH Q2(R2) guidelines.
System Suitability: System suitability was evaluated prior to analysis by recording replicate absorbance measurements of standard solutions of LINA and EMPA under the optimized analytical conditions. Baseline correction was performed using solvent blank before each measurement.
The obtained absorbance values showed satisfactory repeatability with %RSD values less than 2%, indicating adequate performance of the spectrophotometric system and suitability of the developed methods for routine analysis.
Precision: The intra-day and inter-day method precision study was carried out separately at the tablet concentration of LINA (10 μg/mL) and EMPA (20 μg/mL) by analysing six conc. The desired conc. from formulation was obtained after suitable dilution. The concentrations of LINA and EMPA were determined using RS-ERS and RS-CM approach. The calculated % RSD was less than 2 % for both LINA and EMPA. This confirms that the proposed methods were precise.
TABLE 4: PRECISION STUDY OF LINA AND EMPA BY RS-ERS (n = 6)
| Parameters | Linagliptin | Empagliflozin | ||
| Mean Conc. ± SD | %RSD | Mean Conc. ± SD | %RSD | |
| Intra-day | 9.99 ± 0.176 | 1.762 | 19.87 ± 0.307 | 1.544 |
| Inter-day | 10.24 ± 0.125 | 1.225 | 19.99 ± 0.335 | 1.677 |
TABLE 5: PRECISION STUDY OF LINA AND EMPA BY RS-CM (n = 6)
| Parameters | Linagliptin | Empagliflozin | ||
| Mean Conc. ± SD | %RSD | Mean Conc. ± SD | %RSD | |
| Intra-day | 10.13 ± 0.113 | 1.121 | 19.99 ± 0.335 | 1.677 |
| Inter-day | 10.07 ± 0.197 | 1.959 | 19.93 ± 0.368 | 1.850 |
Accuracy: The accuracy of the proposed method was determined at three different concentration levels of assay concentration i.e. 80 %, 100 % and 120 % in triplicate. The accuracy of the method was assessed by determining percentage recoveries of standard drug added at each level after spiking the standard drug into base concentration of formulation.
The study was performed in triplicates. The concentration of LINA and EMPA at each level was determined using RS-ERS and RS-CM approaches. It was observed that the percentage recovery values were within the range (98-102 %) with the % RSD value less than 2. This confirms that the given methods are accurate and precise.
TABLE 6: RESULTS OF ACCURACY STUDY FOR LINA AND EMPA BY RS-ERS
| Level of assay concentration | Amount of base concentration
(μg/mL) |
Amount of standard drug added (μg/mL) | Final concentration (μg/mL) | Amount of standard drug recovered (μg/mL) | % Recovery Mean ± SD, %RSD
(n*=3) |
|||||
| LINA | EMPA | LINA | EMPA | LINA | EMPA | LINA | EMPA | LINA | EMPA | |
| 80% | 6.00 | 12.00 | 4.80 | 9.60 | 10.80 | 21.60 | 4.94 | 9.63 | 100.35 ± 0.35, 0.34 | 100.68 ± 0.65, 0.65 |
| 100% | 6.00 | 12.00 | 6.00 | 12.00 | 12.00 | 24.00 | 5.91 | 12.22 | 100.19 ± 0.42, 0.42 | 101.33 ± 1.15, 1.13 |
| 120% | 6.00 | 12.00 | 7.20 | 14.40 | 13.20 | 26.40 | 7.24 | 14.44 | 100.75 ± 0.31, 0.31 | 100.49 ± 0.42, 0.42 |
TABLE 7: RESULTS OF ACCURACY STUDY FOR LINA AND EMPA BY RS-CM
| Level of assay concentration | Amount of base concentration
(μg/mL) |
Amount of standard drug added (μg/mL) | Final concentration (μg/mL) | Amount of standard drug recovered (μg/mL) | % Recovery Mean ± SD, %RSD
(n*=3) |
|||||
| LINA | EMPA | LINA | EMPA | LINA | EMPA | LINA | EMPA | LINA | EMPA | |
| 80% | 6.00 | 12.00 | 4.80 | 9.60 | 10.80 | 21.60 | 4.97 | 9.63 | 101.59 ± 0.33, 0.33 | 100.57 ± 0.58, 0.58 |
| 100% | 6.00 | 12.00 | 6.00 | 12.00 | 12.00 | 24.00 | 6.04 | 12.22 | 99.94 ± 0.63, 0.63 | 101.14 ± 1.02, 1.01 |
| 120% | 6.00 | 12.00 | 7.20 | 14.40 | 13.20 | 26.40 | 7.36 | 14.72 | 101.20 ± 0.67, 0.67 | 101.56 ± 0.36, 0.35 |
Assay: The validated RS-ERS and RS-CM for the simultaneous estimation of LINA and EMPA were further applied to the analysis of the marketed formulation (EMPACRUX-L) (1:2). The assay results obtained are presented in the table below.
TABLE 8: ASSAY OF LINA AND EMPA
| Parameter | Acceptance criteria | RS-ERS | RS-CM | ||
| LINA | EMPA | LINA | EMPA | ||
| Assay | (n=3) | Average ± SD | Average ± SD | ||
| % content | LINA: 98-102%
EMPA: 98-102% |
101.43±0.603 | 99.98±1.875 | 100.46±1.721 | 98.73±1.097 |
TABLE 9: ROBUSTNESS STUDY OF RS-ERS FOR LINA AND EMPA
| Parameter varied | Condition | %Assay of LINA (Mean ± SD) | %RSD | %Assay of EMPA (Mean ± SD) | %RSD |
| Analytical Wavelength | 292 nm | 99.85 ± 0.52 | 0.52 | 100.21 ± 0.61 | 0.61 |
| 294 nm | 100.00 ± 0.43 | 0.43 | 100.00 ± 0.48 | 0.48 | |
| 296 nm | 100.14 ± 0.57 | 0.57 | 99.76 ± 0.55 | 0.55 | |
| 271 nm | 101.65 ± 0.24 | 0.23 | 101.22 ± 0.23 | 0.22 | |
| 273 nm | 100.13 ± 0.67 | 0.67 | 100.67 ± 0.45 | 0.44 | |
| 275 nm | 99.89 ± 0.11 | 0.11 | 100. 98 ± 0.77 | 0.76 | |
| LINA Divisor concentration | 8μg/mL | 99.71 ± 0.64 | 0.64 | 100.32 ± 0.58 | 0.58 |
| 10μg/mL | 100.00 ± 0.43 | 0.43 | 100.00 ± 0.48 | 0.48 | |
| 12μg/mL | 100.18 ± 0.51 | 0.51 | 99.89 ± 0.63 | 0.63 | |
| EMPA Divisor concentration | 16 μg/mL | 99.92 ± 0.47 | 0.47 | 100.12 ± 0.56 | 0.56 |
| 20 μg/mL | 100.00 ± 0.43 | 0.43 | 100.00 ± 0.48 | 0.48 | |
| 24 μg/mL | 100.59 ± 0.59 | 0.59 | 99.83 ± 0.54 | 0.54 |
TABLE 10: ROBUSTNESS STUDY OF RS-CM FOR LINA AND EMPA
| Parameter varied | Condition | %Assay of LINA (Mean ± SD) | %RSD | %Assay of EMPA (Mean ± SD) | %RSD |
| Analytical Wavelength | 292 nm | 99.91 ± 0.55 | 0.55 | 100.17 ± 0.62 | 0.62 |
| 294 nm | 100.00 ± 0.46 | 0.46 | 100.00 ± 0.51 | 0.51 | |
| 296 nm | 100.11 ± 0.58 | 0.58 | 99.88 ± 0.57 | 0.57 | |
| 271 nm | 101.56 ± 0.21 | 0.21 | 99.45 ± 0.90 | 0.90 | |
| 273 nm | 100.75 ± 0.76 | 0.75 | 100.46 ± 0.88 | 0.89 | |
| 275 nm | 101.01 ± 0.56 | 0.56 | 100.90 ± 0.12 | 0.12 | |
| LINA Divisor concentration | 8μg/mL | 99.80 ± 0.63 | 0.63 | 100.24 ± 0.59 | 0.59 |
| 10μg/mL | 100.00 ± 0.46 | 0.46 | 100.00 ± 0.51 | 0.51 | |
| 12μg/mL | 100.22 ± 0.54 | 0.54 | 99.81 ± 0.65 | 0.65 | |
| Constant Region Selection | 300nm | 99.95 ± 0.49 | 0.49 | 100.10 ± 0.53 | 0.53 |
| 305nm | 100.00 ± 0.46 | 0.46 | 100.00 ± 0.51 | 0.51 | |
| 310 | 100.08 ± 0.57 | 0.57 | 99.92 ± 0.60 | 0.60 |
Acceptance Criteria: %RSD not more than 2%:
Solution Stability: Solution stability was evaluated by monitoring the spectral characteristics of LINA and EMPA at 0, 2, 4, 6, 8 and 24 h.
No significant changes in absorbance or spectral profile were observed during the study period, indicating that both analytes remained stable under the experimental conditions for at least 24 h.
Greenness Assessment for the Drug Combination 28-30: Green chemistry is a widely recognized approach in modern chemistry that aligns with the principles of sustainable development.
It emphasizes conducting chemical processes in a manner that promotes environmental protection, resource efficiency, and economic viability. The integration of green chemistry concepts is now common in both analytical and manufacturing practices, driving a shift in attitudes toward more sustainable chemical development. Evaluating the "greenness" of an analytical method can be challenging due to the multiple factors involved.
It is essential to provide concrete evidence of the method’s actual environmental impact to substantiate its sustainability claims.
In the present study involving the combination of Linagliptin and Empagliflozin, the greenness of the developed analytical methods was assessed using two established tools:
- ComplexGAPI
- AGREE
These tools provide a comprehensive evaluation of environmental friendliness based on various criteria, ensuring that the method adheres to green analytical chemistry principles.
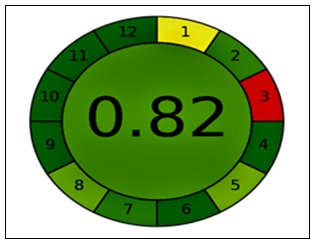
FIG. 22: GREENNESS ASSESSMENT (RS-ERS AND RS-CM) BY AGREE
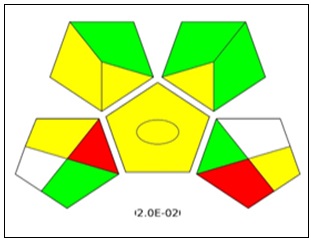
FIG. 23: GREENNESS ASSESSMENT (RS-ERS AND RS-CM) BY Complex GAPI
The greenness of these methods was evaluated using the AGREE and ComplexGAPI tool. For AGREE resulting score was 0.82, which is close to 1, indicating excellent environmental compatibility and for ComplexGAPI the resulting E-factor was found to be 0.2, which is close to zero, indicating minimal waste generation This value confirms that the developed methods align well with green chemistry principles and can be considered environmentally friendly.
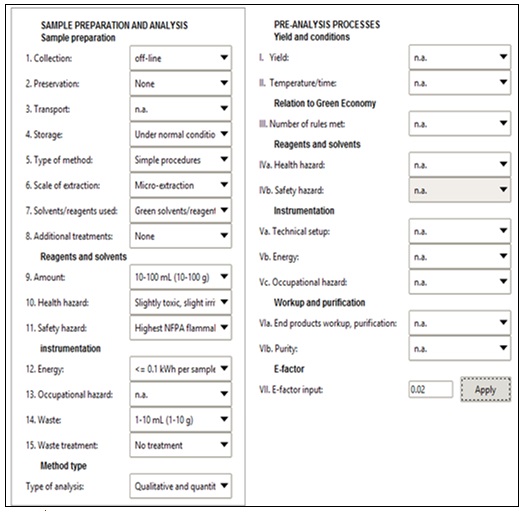
FIG. 24: GRENNESS ASSESSMENT BY COMPLEXGAPI PARAMETERS
TABLE 11: PARAMETERS USED FOR AGREE
| Sr. no. | GAC Principle | Input |
| 1 | Direct analytical techniques should be applied to avoid sample treatment | Off-line analysis |
| 2 | Minimal sample size and minimal number of samples are goals | 0.2 |
| 3 | In situ measurements should be performed/ positioning of analytical device | Off-line |
| 4 | Integration of analytical processes and operations saves energy and reduces the use of reagents. Number of distinct steps | 3 or fewer |
| 5 | Automated and miniaturized methods should be selected | Semi-automatic. None or miniaturized |
| 6 | Derivatization should be avoided | Not applicable |
| 7 | Generation of a large volume of analytical waste should be avoided and proper management of analytical waste should be provided | 0.2 |
| 8 | Multianalyte or multiparameter methods are preferred versus methods using one analyte at a time | 2 analytes determined per hr |
| 15 samples analysed per hr | ||
| 9 | The use of energy should be minimized | UV-VIS spectrophotometry (0.1 kWh) |
| 10 | Reagents obtained from renewable source should be preferred | All reagents are biobased |
| 11 | Toxic reagents should be eliminated or replaced | Method does not involve use of toxic reagents |
| 12 | The safety of the operator should be increased | Threats include highly flammability of the solvent |
CONCLUSION: For the simultaneous determination of Linagliptin and Empagliflozin, the intended Ratio Subtraction–Extended Ratio Subtraction (RS-ERS) and Ratio Subtraction–Constant Multiplication (RS-CM) spectrophotometric methods were successfully developed and validated in bulk and pharmaceutical dosage forms. Both methods showed excellent linearity, accuracy, precision, robustness, and specificity in accordance with ICH validation guidelines. The obtained results confirmed the reliability and reproducibility of the proposed methods for the analysis of the selected drug combination without any prior separation. The developed RS-ERS and RS-CM methods can be effectively applied for routine quality control analysis of Linagliptin and Empagliflozin in pharmaceutical formulations due to their simplicity, rapidity, cost-effectiveness, and satisfactory analytical performance. The use of organic solvents was kept to a minimum to fit in with the criteria of green analytical chemistry.
ACKNOWLEDGEMENT: The authors acknowledge Goa College of Pharmacy for providing laboratory facilities, deeply thankful to the Almighty for His abundant blessings and for granting me the wisdom, good health, and strength. Deeply grateful to my family and friends for their care and support that motivated me throughout the project. I extend my sincere gratitude, Dr. Sachi Kudchadkar, Assistant Professor, Department of Pharmaceutical Analysis, Goa College of Pharmacy, for her unwavering support, encouragement and immense knowledge and insightful feedback throughout this project. I am grateful to Dr. Gopalkrishna Rao, Principal. I extend my heartfelt thanks to Dr. Sanjay Pai PN, Professor and Head of Department of Pharmaceutical chemistry. Sincere gratitude to Dr. Anand A. Mahajan, Professor, Dr. Adison Fernandes and Mrs. Sweta Borkar, Assistant Professor, Department of Pharmaceutical Analysis, for their guidance, thoughtful suggestions, and their support in clarifying concepts during the course of this work.
CONFLICT OF INTEREST: The authors affirm that they have no conflict of interest to disclose.
REFERENCES:
- National Center for Biotechnology Information: PubChem compound summary for linagliptin, CID 10096344. Available from: https://pubchem.ncbi.nlm.nih.gov/compound/10096344
- DrugBank Online: Linagliptin: uses, interactions, mechanism of action. Available from: https://go.drugbank.com/drugs/DB08882
- News-Medical: Mechanism of action of linagliptin. Available from: https://www.news-medical.net/health/Mechanism-of-Action-of-Linagliptin.aspx
- DrugBank Online: Empagliflozin: uses, interactions, mechanism of action. Available from: https://go.drugbank.com/drugs/DB09038
- National Center for Biotechnology Information: PubChem compound summary for empagliflozin, CID 11949646. Available from: https://pubchem.ncbi.nlm.nih.gov/compound/11949646
- Kotla P, Kumar KV, Snehalatha T, Sufiyan MA, Kavya N and Akhila K: UV method development and validation of empagliflozin and linagliptin. World J Pharm Pharm Sci 2025; 14(8): 659-667. DOI: 10.20959/wjpps20258-30440.
- Kamal AH, Hammad SF, Salim MM, Elkhodary MM and Marie AA: Simultaneous estimation of two anti-diabetic drugs; linagliptin and empagliflozin in their tablet by chemometric spectrophotometry. Spectrochim Acta A Mol Biomol Spectrosc 2024; 305: 123556. DOI: 10.1016/j.saa.2023.123556.
- Rane SS, Chaudhari RY, Patil VR and Barde LG: Development and validation of UV spectrophotometric method for simultaneous estimation of empagliflozin and linagliptin in bulk drugs and pharmaceutical dosage form. DIMPSIJ 2021; 1(1): 44-54.
- Ghatol KJ, Vanjari SS and Patil RB: Development and validation of analytical method for simultaneous estimation of empagliflozin and linagliptin in tablet dosage form. Int J Adv Res 2025; 13(10): 1263-1275. DOI: 10.21474/IJAR01/22020.
- Mathew C and Varma S: Green analytical methods based on chemometrics and UV spectroscopy for the simultaneous estimation of empagliflozin and linagliptin. Asian J Pharm Anal 2022; 12(1): 43-48. DOI: 10.52711/2231-5675.2022.00008.
- Ghawate VB and Jadhav MB: Development and validation of RP-HPLC method for simultaneous estimation of empagliflozin and linagliptin in tablet formulation. J Educ Rabindra Bharati Univ 2022; 23(1): 674-681.
- Swami P, Goyal R, Agrawal D and Bhaduka G: Development of a RP-HPLC method for simultaneous estimation of empagliflozin and linagliptin. Pharm Chem J 2023; 10(3): 16-34.
- Saraswathi V, Venkatesh M and Yasodha A: Method development and validation for the simultaneous estimation of empagliflozin and linagliptin in bulk form and marketed tablet dosage forms by RP-HPLC. Int J Res Anal Rev 2023; 10(3): 767-781.
- Bhaduka G and Goyal R: Development of RP-HPLC method for simultaneous estimation of empagliflozin and linagliptin. Chem Res J 2024; 9(2): 121-140.
- Sruthi V and Poornima B: Analytical method development and validation for simultaneous estimation of linagliptin and empagliflozin in bulk and pharmaceutical formulation by RP-HPLC. Int J Pharm Pharm Res 2019; 16(2).
- Adnan M, Khan MN, Ali R, Ullah Z and Ahmed I: RP-HPLC method development and validation for the studies of sodium-glucose co-transporter 2 (SGLT2) and dipeptidyl peptidase 4 (DPP-4) inhibitors empagliflozin and linagliptin in pharmaceutical dosage form. J Popul Ther Clin Pharmacol 2024; 31(5). DOI: 10.53555/jptcp.v31i5.6335.
- Nagamallika G, Vamshkrishna T, Bairam R, Manjunath SY, Reddy NN and Balakrishnaiah P: Method development and validation for the simultaneous estimation of empagliflozin and linagliptin in bulk and tablet dosage form by using HPLC. Int J Innov Res Med Pharm Sci 2025; 13(6).
- Abu Dayyih W, Al Ani I, Al-Shdefat RI, Zakareia Z, Hamid SA and Shakya AK: Development and validation of a stability-indicating HPLC method for empagliflozin and linagliptin in tablet dosage form. Asian J Chem 2021; 33(2): 484-488. DOI: 10.14233/ajchem.2021.23019.
- Mohammad MA, Mahrouse MA, Amer EA, Elharati NS and Michael AM: Simultaneous determination of enalapril maleate and nitrendipine in tablets using spectrophotometric methods manipulating ratio spectra. Spectrochim Acta A Mol Biomol Spectrosc 2021; 244: 118894.
- Kinnerker A, Kumbharjuvekar C, Naik A and Kudchadkar S: Analytical method development and validation of univariate spectrophotometric methods for quantifying binary drug combination in hypertensive care. World J Pharm Res 2026; 15(10): 905-921.
- Malathi DS, Pallavi M and Sunil Kumar: Instrumental Methods of Analysis. Lucknow: Thakur Publication Pvt Ltd, 2020.
- Kamal AH, El-Malla SF and Hammad SF: A review on UV spectrophotometric methods for simultaneous multicomponent analysis. Eur J Pharm Med Res 2016; 3(2): 348-365.
- Ahmed MK, Michael AM, Hassan AS and Abbas SS: Different spectrophotometric methods manipulating ratio spectra for the assay of hydrocortisone acetate and clioquinol in their topical preparation. Eur J Chem 2021; 12(3): 265-272. DOI: 10.5155/eurjchem.12.3.265-272.2093.
- Chaithanya MP, Bhaskar SV, Chawla A, Kumar KRP, Nargund SL and Nargund SL: Method development and validation for the estimation of ritonavir and nirmatrelvir in pharmaceutical dosage form by UV-spectroscopy. Int J Pharm Sci Res 2026; 17(3): 946-953. DOI: 10.13040/IJPSR.0975-8232.17(3).946-53.
- Rao TR and Revanth E: Development and validation of UV spectrophotometric method for the determination of levocetirizine dihydrochloride. Int J Pharm Sci Res 2025; 16(4): 1028-1031. DOI: 10.13040/IJPSR.0975-8232.16(4).1028-31.
- Guduru SK and Dasari PK: Method development, validation and stability indicating studies of hydrochlorothiazide in bulk and pharmaceutical dosage form by UV-spectroscopy. Int J Pharm Sci Res 2024; 15(8): 2411-2414. DOI: 10.13040/IJPSR.0975-8232.15(8).2411-14.
- Nilawar N and Khan T: Analytical method development and validation studies for simultaneous estimation of luliconazole and eugenol using UV-spectroscopy. Int J Pharm Sci Res 2024; 15(7): 2088-2093. DOI: 10.13040/IJPSR.0975-8232.15(7).2088-93.
- American Chemical Society: 12 principles of green chemistry. Washington DC: ACS, 2024.
- Plotka-Wasylka J and Wojnowski W: Complementary green analytical procedure index (ComplexGAPI) and software. Green Chem 2021; 23(21): 8657-8665.
- Pena-Pereira F, Wojnowski W and Tobiszewski M: AGREE-Analytical GRE Enness metric approach and software. Anal Chem 2020; 92: 10076-10082.
How to cite this article:
Kumbharjuvekar C, Gaonkar V, Naik A and Kudchadkar S: Investigation of green UV spectrophotometric techniques for simultaneous estimation of selected fixed-dose combination. Int J Pharm Sci & Res 2026; 17(10): 3154-69. doi: 10.13040/IJPSR.0975-8232.17(10).3154-69.
All © 2026 are reserved by International Journal of Pharmaceutical Sciences and Research. This Journal licensed under a Creative Commons Attribution-NonCommercial-ShareAlike 3.0 Unported License.
Article Information
28
3154-3169
989 KB
5
English
IJPSR
C. Kumbharjuvekar *, V. Gaonkar, A. Naik and S. Kudchadkar
Department of Pharmaceutical Quality Assurance, Goa College of Pharmacy, Panaji, Goa, India.
chandradipkumbharjuvekar@gmail.com
07 June 2026
15 June 2026
20 June 2026
10.13040/IJPSR.0975-8232.17(10).3154-69
01 October 2026
 Download