




SLCO1B1 RS2306283 (C.388A>G) POLYMORPHISM IS ASSOCIATED WITH ALTERED RESPONSE TO ATORVASTATIN IN PATIENTS WITH METABOLIC SYNDROME
HTML Full TextSLCO1B1 RS2306283 (C.388A>G) POLYMORPHISM IS ASSOCIATED WITH ALTERED RESPONSE TO ATORVASTATIN IN PATIENTS WITH METABOLIC SYNDROME
Mohd Tariq Salman, MD. Faiz Akram *, Sukhpreet Singh and Taleem Raza
Department of Pharmacology, Faculty of Dentistry, Jamia Millia Islamia, Delhi, New Delhi, India.
ABSTRACT: Background: Organic anion transporting polypeptide 1B1 (OATP1B1), encoded by the SLCO1B1 gene, plays an important role in hepatic uptake of atorvastatin. Genetic polymorphisms in SLCO1B1 may alter atorvastatin response. Objective: To assess the association of SLCO1B1 rs2306283 (c.388A>G) polymorphism with lipid lowering response to atorvastatin in patients with metabolic syndrome (MetS) attending a tertiary care center in North India. Methods: A total of 121 patients were screened, of whom 91 eligible patients were enrolled. Eighty patients completed the 8-week follow-up and were included in final analysis. Newly diagnosed patients with MetS received atorvastatin 20 mg once daily for 8 weeks. Genotyping for SLCO1B1 rs2306283 polymorphism was performed using PCR-RFLP technique. Lipid parameters and surrogate cardiovascular risk markers were compared among different genotypic variants. Results: Genotype frequencies for AA, AG and GG variants were 25%, 35% and 40%, respectively. Allelic frequencies for A and G alleles were 42.5% and 57.5%, respectively. Patients with GG genotype demonstrated significantly greater increase in HDL cholesterol levels and greater reduction in LDL cholesterol levels after 8 weeks of atorvastatin therapy compared to AA genotype (p<0.05). Significant improvement was also observed in surrogate cardiovascular risk markers including non-HDL cholesterol, cardiac risk ratio, atherogenic coefficient and atherogenic index of plasma in patients carrying G allele. Conclusion: SLCO1B1 rs2306283 (c.388A>G) polymorphism was associated with altered lipid lowering response to atorvastatin in patients with MetS. Presence of G allele was associated with better therapeutic response to atorvastatin. Further large multicentric studies are required to validate these findings.
Keywords: SLCO1B1, rs2306283, Atorvastatin, Pharmacogenetics, Metabolic syndrome, Dyslipidemia
INTRODUCTION: Transportation of statins into hepatocytes is a key step for statins to inhibit the HMG-CoA reductase enzyme involved in the mevalonate pathway.
Organic anion transporting polypeptide 1B1 (OATP1B1) is considered liver specific and is localized on the basolateral membrane of hepatocytes where it plays an important role in hepatic uptake of endogenous organic anions and xenobiotics such as atorvastatin. OATP1B1 is encoded by the SLCO1B1 gene located on chromosome 12 17.
The SLCO1B1 rs2306283 (c.388A>G; p.N130D) polymorphism is associated with altered transporter activity and may influence statin pharmacokinetics and pharmacodynamics 16, 25 demonstrated that patients homozygous for c.388G allele had greater LDL cholesterol reduction following atorvastatin therapy. Similar observations were reported in the Go-DARTS study 8.
Pharmacogenetics studies the role of genetic variability in determining inter-individual variation in drug response. Data regarding association of SLCO1B1 rs2306283 polymorphism with atorvastatin response in Indian patients are limited. Therefore, the present study was planned to assess the prevalence of SLCO1B1 rs2306283 polymorphism and evaluate its association with atorvastatin response in Indian patients with metabolic syndrome.
MATERIAL AND METHODS: The present prospective observational study was conducted in patients attending the Outpatient Department of the Department of Medicine, Era’s Lucknow Medical College and Hospital, Lucknow, India, during the period between February and December 2015. Patients fulfilling the inclusion and exclusion criteria were prescribed atorvastatin 20 mg once daily for 8 weeks. Genotyping was performed and the data were further analyzed by segregating the patients according to their genotype status.
A total of 121 patients were screened during the study period. Ninety-one patients fulfilling the inclusion and exclusion criteria were enrolled. Eleven patients were lost to follow-up or were non-traceable during the 8-week follow-up period. Therefore, final analysis was performed on 80 patients.
Newly diagnosed patients with metabolic syndrome (MetS) as per IDF guidelines, of either sex aged between 18–60 years and willing to provide informed written consent were included in the study. However, patients having severe hepatic or renal impairment, medical emergencies such as seizure disorder, CNS infections, malignancy, pregnancy, lactation, allergy or contraindication to the drug under study were excluded from the study. Patients were also advised not to take drugs known to inhibit OATP1B1 transporter such as cyclosporine, eltrombopag, lapatinib, lopinavir, rifampicin and ritonavir. Patients were prescribed Tab. Atorvastatin 20 mg orally (as per IDF guidelines for treatment of MetS) and were counselled regarding dietary restriction and physical activity.
Demographic data were collected in a structured Case Record Form. Weight of the participants was measured using a weighing scale and recorded to the nearest 0.5 kilogram. Height assessment was done using a height measuring rod without shoes and recorded to the nearest 0.5 centimeter. Body Mass Index (BMI) for each respondent was calculated by dividing weight (kilograms) by height squared (meter). Waist circumference was measured using a measuring tape in a horizontal plane midway between the inferior margin of the ribs and the superior border of the iliac crest 18.
One milliliter of fasting venous blood was collected in a plain vacutainer and allowed to clot. Serum was separated and tested for lipid profile using an automated analyser (Erba 360, Mannheim, USA). Total Cholesterol (TC), Triglycerides (TG), and High Density Lipoprotein Cholesterol (HDL-C) were measured directly. Very Low Density Lipoprotein Cholesterol (VLDL-C) was derived by dividing TG by 5 and Low Density Lipoprotein Cholesterol (LDL-C) was calculated using Friedewald’s formula (TC − HDL − VLDL).
Lipid ratios such as Non-HDL Cholesterol [TC − HDL 10, Atherogenic Coefficient (AC) [non-HDL/HDL, 2, Atherogenic Index of Plasma (AIP) [log TG/HDL, 7 and Cardiac Risk Ratio (CRR) [TC/HDL, 2 were assessed as surrogate markers for cardiovascular risk.
One milliliter of blood was collected in EDTA coated vacutainer after venipuncture. Genomic DNA was isolated from peripheral leukocytes using Genomic DNA kit (TIANamp, China). Quantitative analysis of extracted DNA was performed using Nanodrop Ultraviolet (UV) Spectrophotometer (Thermo Scientific, Wilmington, USA) to assess DNA purity and concentration. Briefly, 1 µl of extracted DNA sample was loaded onto the Nanodrop UV Spectrophotometer and A260/A280 ratio was measured. DNA samples with A260/A280 ratio approaching 1.8 were considered acceptable for PCR amplification. The concentration of DNA present in the extracted sample was also determined.
The presence of SLCO1B1 rs2306283 (c.388A>G) polymorphism was studied using Polymerase Chain Reaction–Restriction Fragment Length Polymorphism (PCR-RFLP) method using Bio-Rad Thermal Cycler (Bio-Rad Life Science, California, USA). PCR amplification of the SLCO1B1 gene was carried out using the method described by Jindal et al., 2009 15. The forward primer sequence used was 5’-GCAAATAAAGGGAAAGACAGA-3’ and the reverse primer sequence was 5’-TCATAATTGTGTGTCCATGCT-3’. The expected amplified product size was 214 bp.
Briefly, PCR was performed with a reaction mixture comprising 2 µl DNA template, 1.5 µl forward primer, 1.5 µl reverse primer, 0.5 µl Taq polymerase, 10 µl master mix and 5 µl nuclease free water, making a final reaction volume of 20 µl. The PCR conditions used for amplification were as follows: 35 cycles of denaturation at 94°C for 1 minute, annealing at 55°C for 1 minute and extension at 72°C for 1 minute, with a final extension at 72°C for 10 minutes. The amplified product was checked using 2% agarose gel electrophoresis.
The amplified product was further digested using TaqI restriction enzyme. Briefly, the reaction mixture comprised 6 µl PCR product, 1 µl restriction enzyme, 2 µl of 10× buffer and 11 µl nuclease free water. The mixture was incubated at 65°C for 6 hours. The digested product was visualized using 10% polyacrylamide gel electrophoresis stained with ethidium bromide dye and visualized under UV transilluminator. Presence of fragments of 151 and 63 bp corresponded to AA genotype, fragments of 151, 128, 63 and 23 bp corresponded to AG genotype, while fragments of 128, 63 and 23 bp corresponded to GG genotype. Genotypes were interpreted independently by two investigators based on expected digestion patterns.
The study protocol was submitted to the Institutional Ethics Committee of Era’s Lucknow Medical College and Hospital, Lucknow, India, for consideration and approval. The study was initiated only after obtaining approval from the Institutional Ethics Committee. Patients fulfilling the inclusion and exclusion criteria were informed about the study using the Patient Information Sheet and were enrolled after obtaining written informed consent. Confidentiality was ensured for all participants included in the study.
The sample size was calculated from the study done by Chen et al., 2009 using the following formula:
N = (Zα)²σ² / D²
Where, σ = 2290 (standard deviation of OCT1 in study population), Mean = 21300 (of OCT1 in study population), D = 2.5% of Mean, Type I error α = 5%, Power of study = 80%, Loss to follow-up = 10%
Calculated sample size: n = 80
All data were subjected to descriptive statistical analysis. Continuous variables were expressed as mean ± standard deviation or mean (95% confidence interval). Normality testing was performed using Shapiro–Wilk test. Metabolic and anthropometric parameters among different genotype groups were compared using ANOVA followed by post hoc Tukey test or Student’s t-test as appropriate. Relationship between genotype and categorical variables was studied using Chi-square test. Hardy–Weinberg equilibrium was assessed using Chi-square goodness-of-fit test. Correlation between allelic variants and the above parameters was analysed using Kendall’s Tau-B test. All statistical analyses were performed using SPSS version 16. A p value <0.05 was considered statistically significant and p value <0.001 was considered highly significant.
RESULTS: A total of 121 patients were screened. 91 patients corresponding to the inclusion and exclusion criteria were enrolled in the study. Baseline parameters (0 week) were noted and patients were advised to come for a follow up visit with at least 12 hour fasting after a period of 8 weeks. Eleven patients did not turn up for the follow up visit and were not traceable.
DNA was isolated from EDTA mixed blood samples. DNA purity and concentration were assessed using UV spectrophotometry by measuring the A260/A280 ratio. The mean A260/A280 ratio obtained was 1.53. Although lower than the ideal purity ratio for genomic DNA, the extracted DNA was successfully amplified by PCR and yielded interpretable genotyping results. The mean DNA concentration obtained was 26.31 ng/µl.
The amplified product was subjected to 10% polyacrylamide Gel Electrophoresis, run parallel to 100 base pair ladder. The gel was then stained with EtBr and was visualized under UV scanner Fig. 1.
The amplified product was found to be of 214 base pair, however a nonspecific band of 400 base pair was also found to have been amplified. Further, the amplified product was incubated with TaqI restriction enzyme after which, the product was run parallel to 100 base pair ladder on 10% Polyacrylamide Gel Electrophoresis. The gel was stained with EtBr for 15 minutes and was further visualized under UV camera.
Upon incubation with the restriction enzyme, the presence of all four fragments (151, 128, 63, 23 base pairs) corresponded to heterozygous AG type while the presence of two fragments (151 and 63 base pairs) corresponded homozygous AA type and presence of three fragments (128, 63 and 23 bps) corresponded to homozygous G type.
Distribution of SLCO1B1 rs2306283 Genotypes: Of the 80 patients included in final analysis, genotype frequencies for AA, AG and GG variants were 25%, 35% and 40%, respectively.
Allele frequency calculations showed A allele frequency of 42.5% and G allele frequency of 57.5% Table 1. Genotype distribution was found to be in Hardy–Weinberg equilibrium (p>0.05).
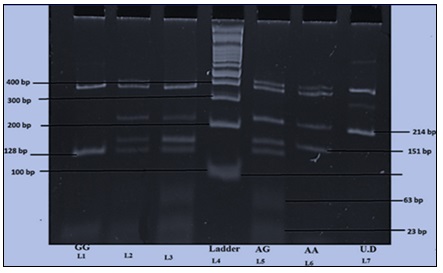
FIG. 1: POLYACRYLAMIDE GEL ELECTROPHORESIS SHOWING PCR-RFLP ANALYSIS OF SLCO1B1 RS2306283 (C.388A>G) POLYMORPHISM IN PATIENTS WITH METABOLIC SYNDROME (METS). LANE M REPRESENTS DNA MARKER; AA GENOTYPE SHOWS FRAGMENTS OF 151 AND 63 BP, AG GENOTYPE SHOWS FRAGMENTS OF 151, 128, 63 AND 23 BP, WHILE GG GENOTYPE SHOWS FRAGMENTS OF 128, 63 AND 23 BP. LANE 1: GG GENOTYPE; LANE 2, 3 & 5: AG GENOTYPE; LANE 6: AA GENOTYPE; LANE 4: REPRESENTS THE MOLECULAR WEIGHT MARKER (100 BASE PAIR DNA LADDER); LANE 7: UNDIGESTED PCR PRODUCT
TABLE 1: FREQUENCY DISTRIBUTION OF SLCO1B1 RS2306283 (C.388A>G) VARIANTS
| Genotype | Number (%) |
| AA | 20 (25.0) |
| AG | 28 (35.0) |
| GG | 32 (40.0) |
| Total | 80 (100) |
| Allele | Frequency |
| A | 68 (42.5%) |
| G | 92 (57.5%) |
After 8 weeks of atorvastatin administration, all the groups had increased blood HDL levels however, the patients who were homozygous for G allele had significantly greater increase in blood HDL Cholesterol levels as compared to those who were homozygous for A allele (p < 0.05) Table 2 and Table 6. Similarly the patients with homozygous G variant for SLCO1B1 gene achieved 10.58% and 10.72% greater mean difference increase in blood HDL levels when compared to those who were homozygous for A allele (p < 0.05) and heterozygous for A allele (p < 0.01), respectively Fig. 2.
TABLE 2: LIPID PARAMETERS AT BASELINE AND AFTER 8 WEEKS OF ATORVASTATIN THERAPY IN DIFFERENT SLCO1B1 RS2306283 GENOTYPES
| Parameter | Interval | AA Mean (95% CI) | AG Mean (95% CI) | GG Mean (95% CI) | Overall Mean (95% CI) | F-value | P-value |
| TG (mg/dl) | Baseline | 199.89 (176.5–223.2) | 249.52 (209.8–289.1) | 242.4 (214.6–270.2) | 234.2 (215.7–252.7) | 2.41 | 0.096 |
| 8 weeks | 195.4 (172.8–217.9) | 233.2 (194.8–271.7) | 214.28 (186.6–241.9) | 216.2 (198.3–234.0) | 1.32 | 0.271 | |
| HDL-C (mg/dl) | Baseline | 39.13 (37.64–40.62) | 40.61 (38.55–42.66) | 38.56 (36.9–40.2) | 39.42 (38.4–40.4) | 1.554 | 0.218 |
| 8 weeks | 42.1 (40.3–43.8) | 43.36 (41.5–45.1) | 45.47 (43.52–47.42)* | 43.89 (42.7–44.9) | 3.301 | 0.042 | |
| LDL-C (mg/dl) | Baseline | 132.8 (118.1–147.5) | 138.4 (126.5–150.2) | 136.2 (124.1–148.3) | 135.9 (128.3–143.4) | 0.421 | 0.658 |
| 8 weeks | 116.02 (98.4–133.6) | 95.5 (88.4–102.6) | 88.2 (74.1–102.3)* | 98.4 (91.1–105.7) | 4.218 | 0.018 | |
| TC (mg/dl) | Baseline | 210.3 (195.4–225.1) | 219.5 (206.4–232.5) | 214.8 (201.2–228.4) | 215.4 (207.3–223.5) | 0.712 | 0.493 |
| 8 weeks | 188.4 (173.2–203.5) | 176.2 (165.3–187.1) | 168.3 (154.6–182.0) | 176.5 (169.1–183.9) | 3.102 | 0.051 |
*P<0.05 compared with AA genotype. TG: Triglycerides; HDL: High Density lipoprotein; TC: Total Cholesterol; LDL: Low Density Lipoprotein; VLDL: Very Low Density Lipoprotein. P Value <0.05 is considered as significant.
Moreover, at 8 weeks, the patients with GG genotype had significantly lower blood LDL Cholesterol levels as compared to those who had AA genotype (p < 0.05) Table 2 and Table 7. All the groups had achieved the reduction in blood LDL cholesterol levels after 8 weeks but the patients who were homozygous for G allele had maximum reduction in blood LDL Cholesterol levels (32.93% ±14.
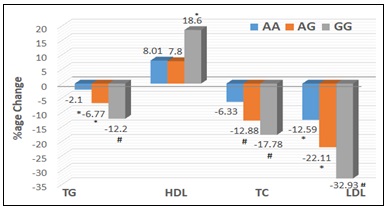
FIG. 2: PERCENTAGE CHANGE IN LIPID PARAMETERS FOLLOWING 8 WEEKS OF ATORVASTATIN THERAPY AMONG DIFFERENT SLCO1B1 RS2306283 (C.388A>G) GENOTYPIC VARIANTS IN PATIENTS WITH METABOLIC SYNDROME. TG: Triglycerides; HDL: High Density lipoprotein; TC: Total Cholesterol; LDL: Low Density Lipoprotein; * p <0.05, # p <0.001.
A positive correlation was seen between the presence of G allele and HDL levels post treatment, with GG genotype showing the greatest and AA genotype showing the lowest HDL levels post treatment Table 3. We found a negative correlation between TG, LDL, VLDL and TC levels and presence of G allele Table 3.
TABLE 3: PERCENTAGE CHANGE IN LIPID PARAMETERS FOLLOWING ATORVASTATIN THERAPY
| Parameter | AA (%) | AG (%) | GG (%) | P value |
| TG | -2.24 ± 6.4 | -6.53 ± 8.2 | -11.61 ± 10.3 | 0.084 |
| HDL-C | 8.01 ± 10.6 | 7.87 ± 13.7 | 18.6 ± 12.7* | 0.031 |
| LDL-C | -12.59 ± 5.6 | -22.11 ± 9.1 | -32.9 ± 14.1* | 0.012 |
| TC | -10.4 ± 6.2 | -19.7 ± 10.5 | -24.3 ± 12.2 | 0.061 |
TG: Triglycerides; HDL: High Density lipoprotein; TC: Total Cholesterol; LDL: Low Density Lipoprotein
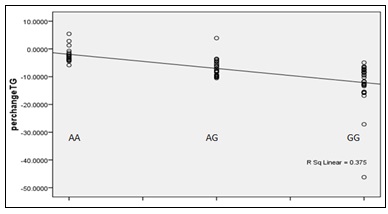
FIG. 3: CORRELATION BETWEEN SLCO1B1 RS2306283 GENOTYPE VARIANTS AND PERCENTAGE CHANGE IN TRIGLYCERIDE LEVELS FOLLOWING 8 WEEKS OF ATORVASTATIN THERAPY IN PATIENTS WITH METABOLIC SYNDROME
Non HDL cholesterol and atherogenic coefficient, markers for predicting future risk of coronary artery disease were calculated using the above mentioned formulas. The patients who had homozygous G allele showed a trend toward greater reduction following administration of atorvastatin in terms of lowering the markers for future coronary artery diseases Table 4.
The patients with GG genotype achieved a greater reduction in non-HDL Cholesterol levels (as compared to those with AA genotype (p < 0.05), furthermore, patients with GG genotype had 8.79% and 16.53% greater reduction in non-HDL Cholesterol levels when compared to AG and AA genotypes, respectively Fig. 4.
TABLE 4: SURROGATE CARDIOVASCULAR RISK MARKERS AT BASELINE AND AFTER 8 WEEKS OF ATORVASTATIN THERAPY
| Parameter | Interval | AA Mean (95% CI) | AG Mean (95% CI) | GG Mean (95% CI) | Overall Mean (95% CI) | F value | P value |
| Non-HDL-C | Baseline | 171.17 (151.6–190.7) | 172.3 (162.6–182.0) | 174.9 (160.9–188.8) | 173.09 (165.3–180.8) | 0.079 | 0.924 |
| 8 weeks | 155.1 (136.5–173.6) | 142.21 (133.5–150.8) | 131.09 (116.4–145.7)* | 140.9 (133.0–148.9) | 2.914 | 0.06 | |
| AC | Baseline | 4.46 (3.8–5.1) | 4.36 (3.94–4.7) | 4.66 (4.14–5.18) | 4.50 (4.2–4.8) | 0.394 | 0.676 |
| 8 weeks | 3.75 (3.1–4.3) | 3.32 (3.0–3.5) | 2.97 (2.5–3.3)* | 3.29 (3.0–3.5) | 3.58 | 0.032 | |
| CRR | Baseline | 5.46 (4.8–6.1) | 5.36 (4.9–5.7) | 5.66 (5.1–6.1) | 5.50 (5.21–5.8) | 0.394 | 0.676 |
| 8 weeks | 4.75 (4.1–5.3) | 4.32 (4.0–4.5) | 3.97 (3.5–4.3)* | 4.29 (4.0–4.5) | 3.585 | 0.032 | |
| AIP | Baseline | 1.74 (1.5–1.9) | 1.89 (1.7–2.0) | 1.50 (1.4–1.7) | 1.73 (1.6–1.8) | 4.465 | 0.015 |
| 8 weeks | 1.59 (1.3–1.8) | 1.60 (1.4–1.7) | 1.46 (1.3–1.5) | 1.54 (1.4–1.6) | 1.392 | 0.255 |
*P <0.05 compared with AA genotype. Non-HDL-C = Non-High Density Lipoprotein Cholesterol; AC = Atherogenic Coefficient; CRR = Cardiac Risk Ratio; AIP = Atherogenic Index of Plasma; CI = Confidence Interval.
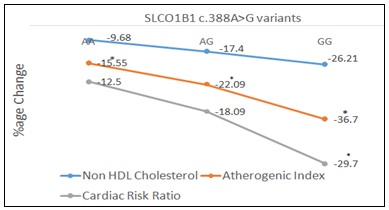
FIG. 4: PERCENTAGE CHANGE IN SURROGATE CARDIOVASCULAR RISK MARKERS FOLLOWING 8 WEEKS OF ATORVASTATIN THERAPY AMONG DIFFERENT SLCO1B1 RS2306283 (C.388A>G) GENOTYPIC VARIANTS IN PATIENTS WITH METABOLIC SYNDROME. * P value<0.05
The patients with GG genotype had greater baseline atherogenic coefficient of all the three allelic variants, however the difference was not statistically significant. But the administration of atorvastatin for 8 weeks produced a significantly greater reduction in the atherogenic coefficient in the patients who had GG genotype when compared to AA genotype (p < 0.05) Table 5. They had 14.61% and 21.15% greater reduction in atherogenic coefficient as compared to the patients who had AG and GG genotypes, respectively (p < 0.001) Fig. 4. The patients having G allele had negative relationship with the values of the predicting markers for future cardiovascular diseases, after 8 weeks of therapy Table 5 Fig. 5.
TABLE 5: CORRELATION BETWEEN SLCO1B1 RS2306283 (C.388A>G) GENOTYPIC VARIANTS AND PERCENTAGE CHANGE IN SURROGATE CARDIOVASCULAR RISK MARKERS FOLLOWING 8 WEEKS OF ATORVASTATIN THERAPY
| Parameter | Kendall’s Tau-B Correlation Coefficient (τb) | 95% Confidence Interval | P value |
| Percentage change in Non-HDL Cholesterol | -0.605 | -0.731 to -0.438 | <0.001 |
| Percentage change in Atherogenic Coefficient (AC) | -0.499 | -0.648 to -0.305 | <0.001 |
| Percentage change in Cardiac Risk Ratio (CRR) | -0.492 | -0.642 to -0.296 | <0.001 |
| Percentage change in Atherogenic Index of Plasma (AIP) | -0.429 | -0.591 to -0.221 | <0.001 |
Negative correlation indicates greater improvement in surrogate cardiovascular risk markers with increasing frequency of G allele variants (AA → AG → GG).
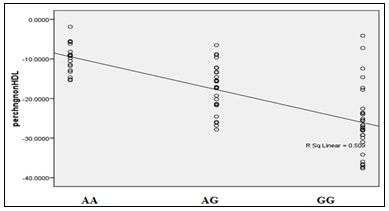
FIG. 5: CORRELATION BETWEEN SLCO1B1 RS2306283 (C.388A>G) GENOTYPIC VARIANTS AND PERCENTAGE CHANGE IN NON-HDL CHOLESTEROL FOLLOWING 8 WEEKS OF ATORVASTATIN THERAPY IN PATIENTS WITH METABOLIC SYNDROME
TABLE 6: DIFFERENCE IN LIPID HDL CHOLESTEROL LEVELS NORMALISATION IN STUDY SUBJECTS AFTER 8 WEEKS OF TREATMENT WITH ATORVASTATIN
| SLCO1B1 c.388A>G variants | Total (N) | ||||||
| AA (N) | AG (N) | GG (N) | |||||
| M | HDL
(mg/dl)) |
<40 | Pre | 5 | 11 | 17 | 33 |
| Post | 1 | 4 | 4 | 9 | |||
| 40-50 | Pre | 4 | 1 | 3 | 8 | ||
| Post | 8 | 7 | 12 | 27 | |||
| >50 | Pre | 0 | 1 | 0 | 1 | ||
| Post | 0 | 2 | 4 | 6 | |||
| Total | Pre | 9 | 13 | 20 | 42 | ||
| Post | 9 | 13 | 20 | 42 | |||
| F | HDL
(mg/dl)) |
<40 | Pre | 8 | 4 | 5 | 17 |
| Post | 5 | 2 | 2 | 9 | |||
| 40-50 | Pre | 3 | 11 | 7 | 21 | ||
| Post | 6 | 13 | 5 | 24 | |||
| >50 | Pre | 0 | 0 | 0 | 0 | ||
| Post | 0 | 0 | 5 | 5 | |||
| Total | Pre | 11 | 15 | 12 | 38 | ||
| Post | 11 | 15 | 12 | 38 | |||
TABLE 7: DIFFERENCE IN LIPID LDL CHOLESTEROL LEVELS NORMALISATION IN STUDY SUBJECTS AFTER 8 WEEKS OF TREATMENT WITH ATORVASTATIN
| LDL (mg/dl)
|
SLCO1B1 c.388A>G variants | Total
(N) |
|||
| AA (N) | AG (N) | GG (N) | |||
| <100 | Pre | 3 | 2 | 6 | 11 |
| Post | 18 | 28 | 32 | 78 | |
| 100-129 | Pre | 9 | 16 | 12 | 37 |
| Post | 1 | 0 | 0 | 1 | |
| 130-159 | Pre | 3 | 9 | 11 | 23 |
| Post | 1 | 0 | 0 | 1 | |
| 160-189 | Pre | 4 | 1 | 2 | 7 |
| Post | 0 | 0 | 0 | 0 | |
| >189 | Pre | 1 | 0 | 1 | 2 |
| Post | 0 | 0 | 0 | 0 | |
| Total | Pre | 20 | 28 | 32 | 80 |
| Post | 20 | 28 | 32 | 80 | |
TABLE 8: LIVER FUNCTION TESTS AND RENAL FUNCTION TESTS AT BASELINE (0 WEEK) AND AFTER TREATMENT (8 WEEKS) ACCORDING TO SLCO1B1 RS2306283 (C.388A>G) GENOTYPIC VARIANTS IN PATIENTS WITH METABOLIC SYNDROME
| Parameter | Interval | AA Mean (95% CI) | AG Mean (95% CI) | GG Mean (95% CI) | Overall Mean (95% CI) | F value | P value |
| SGOT (IU/L) | Baseline | 37.58 (32.28–42.88) | 33.88 (29.10–38.60) | 34.61 (30.50–38.60) | 35.10 (32.50–37.60) | 0.684 | 0.507 |
| 8 weeks | 38.40 (34.30–42.40) | 31.94 (28.00–35.80) | 32.99 (28.90–37.00) | 34.00 (31.60–36.20) | 1.892 | 0.158 | |
| SGPT (IU/L) | Baseline | 31.84 (26.40–37.20) | 28.71 (24.90–32.50) | 29.37 (26.30–32.30) | 29.75 (27.60–31.90) | 0.612 | 0.545 |
| 8 weeks | 31.45 (27.00–35.80) | 29.52 (26.50–32.40) | 29.00 (26.60–31.40) | 29.80 (28.00–31.50) | 0.394 | 0.676 | |
| ALP (IU/L) | Baseline | 95.00 (79.00–110.90) | 87.29 (80.60–93.90) | 93.28 (83.70–102.70) | 91.61 (85.80–97.30) | 0.621 | 0.540 |
| 8 weeks | 88.30 (77.30–99.20) | 90.07 (83.40–96.70) | 93.00 (84.40–101.60) | 90.81 (86.00–95.60) | 0.287 | 0.751 | |
| S. Bilirubin (mg/dl) | Baseline | 0.37 (0.27–0.48) | 0.29 (0.25–0.34) | 0.30 (0.24–0.35) | 0.31 (0.28–0.35) | 1.944 | 0.150 |
| 8 weeks | 0.29 (0.23–0.35) | 0.27 (0.23–0.30) | 0.30 (0.25–0.34) | 0.29 (0.26–0.31) | 0.824 | 0.442 | |
| Blood Urea (mg/dl) | Baseline | 32.74 (27.80–37.60) | 26.97* (24.50–29.40) | 26.91* (24.10–29.60) | 28.39 (26.50–30.20) | 4.127 | 0.020 |
| 8 weeks | 29.01 (24.40–33.55) | 26.46 (23.40–29.40) | 27.26 (24.70–29.80) | 27.43 (25.60–29.20) | 1.228 | 0.299 | |
| S.Cr. (mg/dl) | Baseline | 0.78 (0.69–0.87) | 0.83 (0.73–0.92) | 0.83 (0.74–0.93) | 0.82 (0.76–0.87) | 0.491 | 0.614 |
| 8 weeks | 0.70 (0.62–0.78) | 0.76 (0.71–0.82) | 0.75 (0.70–0.81) | 0.74 (0.71–0.78) | 0.638 | 0.531 |
*P <0.05 compared with AA genotype. SGOT = Serum Glutamic Oxaloacetic Transaminase; SGPT = Serum Glutamic Pyruvic Transaminase; ALP = Serum Alkaline Phosphatase; S. Bilirubin= Serum Bilirubin; S. Cr.= serum Creatinine; CI = Confidence Interval.
No clinically significant alterations in liver or renal function tests were observed among the different SLCO1B1 rs2306283 genotypic variants following atorvastatin therapy
DISCUSSION: The present study evaluated the association of SLCO1B1 rs2306283 (c.388A>G) polymorphism with atorvastatin response in Indian patients with metabolic syndrome. The findings suggest that genetic variability in SLCO1B1 may influence the lipid-lowering response to atorvastatin.
Patients carrying the GG genotype demonstrated comparatively greater improvement in HDL cholesterol and LDL cholesterol levels following atorvastatin therapy than patients with AA genotype. In a previous clinical study conducted in Indian patients with obesity-associated type 2 diabetes mellitus, atorvastatin therapy produced significant improvements in lipid parameters and inflammatory markers, further supporting the beneficial effects of statin therapy in cardiometabolic disorders.
However, the present study extends these observations by exploring the contribution of SLCO1B1 genetic variability to interindividual differences in atorvastatin response 26. Improvement in surrogate cardiovascular risk markers such as non-HDL cholesterol, cardiac risk ratio, and atherogenic coefficient was also more pronounced among patients carrying the G allele. However, some parameters demonstrated only trends toward improvement and did not achieve statistical significance. The observed frequency of the G allele in the present study was comparable to frequencies reported in several Asian populations. Similar findings regarding altered atorvastatin response associated with SLCO1B1 rs2306283 polymorphism have been reported by Rodrigues et al. and by the Go-DARTS study, where carriers of the G allele demonstrated greater reduction in LDL cholesterol following atorvastatin therapy 24 also reported an association between rs2306283 polymorphism and HDL cholesterol response to atorvastatin. Atorvastatin is a substrate of the hepatic uptake transporter OATP1B1 encoded by the SLCO1B1 gene. The rs2306283 (c.388A>G; p.N130D) polymorphism may alter transporter activity and hepatic uptake of atorvastatin, thereby contributing to interindividual variability in therapeutic response. Enhanced hepatic uptake associated with the G allele has been proposed as one possible explanation for improved lipid-lowering response observed in some studies. Recent evidence has also suggested that the rs2306283 G allele may be associated with increased OATP1B1 transporter activity, resulting in altered statin disposition and potentially enhanced lipid-lowering efficacy, although findings across populations remain inconsistent. These observations are broadly consistent with the direction of effect observed in the present study 9.
The present study also evaluated surrogate cardiovascular risk markers including non-HDL cholesterol, cardiac risk ratio, atherogenic coefficient, and atherogenic index of plasma. Although improvements in several of these parameters were observed among patients carrying the G allele, these markers should be interpreted cautiously as indirect surrogate indicators rather than direct measures of cardiovascular outcomes. No clinically significant deterioration in liver function tests or renal function tests was observed following atorvastatin therapy in any genotype group, suggesting acceptable short-term tolerability of atorvastatin in the study population.
Limitations: The findings of the present study should be interpreted in light of certain limitations. The study was conducted at a single center with a relatively modest sample size and short follow-up duration. Plasma atorvastatin concentrations were not measured, and sequencing-based confirmation of genotypes was not performed. In addition, dietary adherence, lifestyle modification, and concomitant medications may also influence lipid-lowering response and could not be controlled completely despite counselling and exclusion of major interacting drugs. Despite these limitations, the study provides preliminary evidence regarding the possible role of SLCO1B1 rs2306283 polymorphism in determining atorvastatin response in Indian patients with metabolic syndrome. Further multicentric studies with larger sample sizes and longer follow-up are required to validate these observations and clarify their potential clinical utility in personalized statin therapy.
CONCLUSION: SLCO1B1 rs2306283 (c.388A>G) polymorphism was associated with altered atorvastatin response in Indian patients with metabolic syndrome. Presence of the G allele was associated with comparatively greater improvement in HDL cholesterol, LDL cholesterol, and certain surrogate cardiovascular risk markers following atorvastatin therapy. These findings suggest a possible role of SLCO1B1 polymorphism in influencing atorvastatin response; however, larger studies are required before routine clinical application can be recommended.
ACKNOWLEDGEMENTS: Nil
CONFLICTS OF INTEREST: Nil
REFERENCES:
- Barter P, Brandrup-Wognsen G, Palmer M & Nicholls S: Effect of statins on HDL-C: a complex process unrelated to changes in LDL-C: analysis of the VOYAGER Database. The Journal of Lipid Research 2009; 51(6): 1546-1553. http://dx.doi.org/10.1194/jlr.p002816
- Brehm A: Relationship between Serum Lipoprotein Ratios and Insulin Resistance in Obesity. Clinical Chemistry 2004; 50(12): 2316-2322. http://dx.doi.org/10.1373/clinchem.2004.037556
- Brunzell J, Davidson M, Furberg C, Goldberg R, Howard B, Stein J & Witztum J: Lipoprotein management in patients with cardiometabolic risk: consensus statement from the american diabetes association and the american college of cardiology foundation. Diabetes Care 2008; 31(4): 811-822. http://dx.doi.org/10.2337/dc08-9018.
- Chapman M: Non-high-density lipoprotein cholesterol as a risk factor: addressing risk associated with apolipoprotein B-containing lipoproteins. European Heart Journal Supplements 2004; 6: 43-48. http://dx.doi.org/10.1016/j.ehjsup.2004.01.010
- Couvert P, Giral P, Dejager S, Gu J, Huby T & Chapman M: Association between a frequent allele of the gene encoding OATP1B1 and enhanced LDL-lowering response to fluvastatin therapy. Pharmacogenomics 2008; 9(9): 1217-1227. http://dx.doi.org/10.2217/14622416.9.9.1217
- DeGorter M, Tirona R, Schwarz U, Choi Y, Dresser G & Suskin N: Clinical and pharmacogenetic predictors of circulating atorvastatin and rosuvastatin concentrations in routine clinical care. Circulation: Cardiovascular Genetics 2013; 6(4): 400-408. http://dx.doi.org/10.1161/circgenetics.113.000099
- Dobiás̆ová M & Frohlich J: The plasma parameter log (TG/HDL-C) as an atherogenic index: correlation with lipoprotein particle size and esterification rate inapob-lipoprotein-depleted plasma (FERHDL). Clinical Biochemistry 2001; 34(7): 583-588. http://dx.doi.org/10.1016/s0009-9120(01)00263-6
- Donnelly L, Doney A, Tavendale R, Lang C, Pearson E & Colhoun H: Common Nonsynonymous Substitutions in SLCO1B1 Predispose to Statin Intolerance in Routinely Treated Individuals With Type 2 Diabetes: A Go-DARTS Study. Clin Pharmacol Ther 2010; 89(2): 210-216. http://dx.doi.org/10.1038/clpt.2010.255.
- Farooq T, Sharma R, Gupta A, Khan M and Verma S: Impact of SLCO1B1 (rs2306283) polymorphism on statin response and clinical outcomes: a review of pharmacogenetic evidence. Cureus 2025; 17(11): 77594.
- Frick M, Elo O, Haapa K, Heinonen O, Heinsalmi P & Helo P: Helsinki heart study: primary-prevention trial with gemfibrozil in middle-aged men with dyslipidemia. New England Journal of Medicine 1987; 317(20): 1237-1245. http://dx.doi.org/10.1056/nejm198711123172001
- Frontini M, Srinivasan S, Xu J, Tang R, Bond M & Berenson G: Utility of Non–High-Density Lipoprotein Cholesterol Versus Other Lipoprotein Measures in Detecting Subclinical Atherosclerosis in Young Adults (The Bogalusa Heart Study). The American Journal of Cardiology 2007; 100(1): 64-68.
- Fu Q, Li Y, Gao Y, Yang S, Lu P, Jia M & Zhang LL: Lack of association between SLCO1B1 polymorphism and the lipid-lowering effects of atorvastatin and simvastatin in Chinese individuals. European Journal of Clinical Pharmacology 2012; 69(6): 1269-1274. http://dx.doi.org/10.1007/s00228-012-1453-9
- Gordon D, Probstfield J, Garrison R, Neaton J, Castelli W & Knoke J: High-density lipoprotein cholesterol and cardiovascular disease. Four prospective American studies. Circulation 1989; 79(1): 8-15. http://dx.doi.org/10.1161/01.cir.79.1.8
- https://www.idf.org/webdata/docs/IDF_Meta_def_final.pdf. Last visited on 3-11-2015
- Jindal C, Kumar S, Choudhari G, Goel H and Mittal B: Organic anion transporter protein (OATP1B1) encoded by SLCO1B1 gene polymorphism (388A>G) & susceptibility in gallstone disease. Indian J Med Res 2009; 129(2): 170-175.
- König J, Seithel A, Gradhand U & Fromm M: Pharmacogenomics of human OATP transporters. Naunyn-Schmiedeberg's Archives of Pharmacology 2006; 372(6): 432-443. http://dx.doi.org/10.1007/s00210-006-0040-y
- König J, Cui Y, Nies A and Keppler D: A novel human organic anion transporting polypeptide localized to the basolateral hepatocyte membrane. Am J Physiol Gastrointest Liver Physiol 2000; 278(1): 156-164.
- Lean M, Han T & Morrison C: Waist circumference as a measure for indicating need for weight management. BMJ 1995; 311(6998): 158-161. http://dx.doi.org/10.1136/bmj.311.6998.158
- Mwinyi J, Köpke K, Schaefer M, Roots I & Gerloff T: Comparison of SLCO1B1 sequence variability among German, Turkish, and African populations. European Journal of Clinical Pharmacology 2008; 64(3): 257-266. http://dx.doi.org/10.1007/s00228-007-0409-y
- Niemi M, Pasanen M & Neuvonen P: Organic Anion Transporting Polypeptide 1B1: a Genetically Polymorphic Transporter of Major Importance for Hepatic Drug Uptake. Pharmacological Reviews 2011; 63(1): 157-181. http://dx.doi.org/10.1124/pr.110.002857
- Nies A, Niemi M, Burk O, Winter S, Zanger U & Stieger B: Genetics is a major determinant of expression of the human hepatic uptake transporter OATP1B1, but not of OATP1B3 and OATP2B1. Genome Medicine 2013; 5(1): 1. http://dx.doi.org/10.1186/gm405
- Pasanen M, Neuvonen P & Niemi M: Global analysis of genetic variation in SLCO1B1. Pharmacogenomics 2008; 9(1): 19-33. http://dx.doi.org/10.2217/14622416.9.1.19
- Peng K, Bacon J, Zheng M, Guo Y & Wang M: Ethnic Variability in the Expression of Hepatic Drug Transporters: Absolute Quantification by an Optimized Targeted Quantitative Proteomic Approach. Drug Metabolism and Disposition 2015; 43(7): 1045-1055. http://dx.doi.org/10.1124/dmd.115.063362
- Prado Y, Saavedra N, Zambrano T, Lagos J, Rosales A & Salazar L: SLCO1B1 c.388A>G Polymorphism Is Associated with HDL-C Levels in Response to Atorvastatin in Chilean Individuals. IJMS 2015; 16(9): 20609-20619. http://dx.doi.org/10.3390/ijms160920609
- Rodrigues A, Perin P, Purim S, Silbiger V, Genvigir F & Willrich M: Pharmacogenetics of OATP Transporters Reveals That SLCO1B1 c.388A>G Variant Is Determinant of Increased Atorvastatin Response. IJMS 2011; 12(12): 5815-5827. http://dx.doi.org/10.3390/ijms12095815
- Sindhu S, Singh HK, Salman MT, Fatima J and Verma VK: Effects of atorvastatin and rosuvastatin on high-sensitivity C-reactive protein and lipid profile in obese type 2 diabetes mellitus patients. J Pharmacol Pharmacother 2011; 2(4): 261-265.
- Virani S: Non-HDL Cholesterol as a Metric of Good Quality of Care. Opportunities and Challenges. Tex Heart Inst J 2011; 38(2): 160–162.
How to cite this article:
Salman MT, Akram F, Singh S and Raza T: SLCO1B1 rs2306283 (c.388a>g) polymorphism is associated with altered response to atorvastatin in patients with metabolic syndrome. Int J Pharm Sci & Res 2026; 17(9): 2705-14. doi: 10.13040/IJPSR.0975-8232.17(9).2705-14.
All © 2026 are reserved by International Journal of Pharmaceutical Sciences and Research. This Journal licensed under a Creative Commons Attribution-NonCommercial-ShareAlike 3.0 Unported License.
Article Information
14
2705-2714
816 KB
4
English
IJPSR
Mohd Tariq Salman, MD. Faiz Akram *, Sukhpreet Singh and Taleem Raza
Department of Pharmacology, Faculty of Dentistry, Jamia Millia Islamia, Delhi, New Delhi, India.
dr.faizakram@gmail.com
23 April 2026
23 June 2026
25 June 2026
10.13040/IJPSR.0975-8232.17(9).2705-14
01 September 2026
 Download