




UV SPECTRAL STRATEGIES FOR ANALYTICAL METHOD DEVELOPMENT OF MULTICOMPONENT DRUG FORMULATION
HTML Full TextUV SPECTRAL STRATEGIES FOR ANALYTICAL METHOD DEVELOPMENT OF MULTICOMPONENT DRUG FORMULATION
A. Naik *, S. Kanolkar, C. Kumbharjuvekar and S. Kudchadkar
Department of Pharmaceutical Quality Assurance, Goa College of Pharmacy, Panaji, Goa, India.
ABSTRACT: This research work aimed at the development and validation of three UV spectrophotometric methods, namely, Ratio Subtraction and Extended Ratio Subtraction (RS-ERS), Ratio Subtraction coupled with Constant Multiplication (RS-CM), and Ratio Subtraction coupled with Spectrum Subtraction (RS-SS) for the simultaneous estimation of Benidipine Hydrochloride (BEN) and Chlorthalidone (CHL) in their combined pharmaceutical dosage form. BEN was detected at 237 nm and CHL at 275 nm. For determination of CHL, BEN at 10 µg/mL was used as the divisor; for determination of BEN, CHL at 18.7 µg/mL was used as the divisor. The methods were validated in accordance with ICH Q2(R2) guidelines for linearity, specificity, accuracy, precision, robustness, LOD, and LOQ. The linearity was established in the concentration ranges of 4-12 µg/mL for BEN and 6.2-18.7 µg/mL for CHL, and good correlation coefficients (r² = 0.9996) were obtained for all methods. Precision studies demonstrated %RSD values below 2% for both intra-day and inter-day analysis, reflecting good repeatability and intermediate precision. The accuracy results were within the acceptable range of 98–102%. The developed methods were found to be robust with %RSD values below 2%. The methods showed adequate sensitivity with LOD and LOQ values of 0.29 µg/mL and 0.87 µg/mL for BEN and 1.10 µg/mL and 3.34 µg/mL for CHL, respectively. The assay of the commercial formulation yielded results within pharmacopeial specifications. The greenness and sustainability of the methods were evaluated using AGREE and ComplexGAPI tools.
Keywords: Chlorthalidone, Benidipine hydrochloride, Extended ratio subtraction, Ratio subtraction, Constant multiplication, Spectrum subtraction, UV spectrophotometry, Method validation, ICH Q2(R2) guidelines, Green analytical chemistry
INTRODUCTION: Chlorthalidone (CHL), chemically (RS)-2-Chloro-5-(1-hydroxy-3-oxo-2,3-dihydro-1H-isoindol-1-yl) benzene-1-sulfonamide, is a thiazide-like diuretic commonly used for the treatment of hypertension and edema. Benidipine Hydrochloride (BEN), chemically 5-O-[(3R)-1-benzylpiperidin-3-yl] 3-O-methyl (4R)-2, 6-dimethyl-4-(3-nitrophenyl)-1, 4-dihydropyridine-3, 5-dicarboxylate hydrochloride, is a calcium channel blocker used for the treatment of hypertension.
The combination of CHL and BEN is available as a fixed-dose tablet formulation and offers enhanced antihypertensive efficacy by acting through complementary mechanisms. Their chemical structures are shown in Fig. (1A) and Fig. (1B). The simultaneous determination of CHL and BEN by UV spectrophotometry is analytically difficult due to the overlapping absorption spectra of both drugs, which makes the direct quantification difficult without prior separation.
To overcome the above limitation, the ratio spectra-based spectrophotometric methods offer a simple, rapid, and cost-effective alternative for the resolution of overlapping spectra. Three ratio spectra-based methods, including Ratio Subtraction and Extended Ratio Subtraction (RS-ERS), Ratio Subtraction coupled with Constant Multiplication (RS-CM), and Ratio Subtraction coupled with Spectrum Subtraction (RS-SS) were developed and validated for the simultaneous estimation of CHL and BEN in bulk and pharmaceutical dosage forms in the present study. The methods allow for the accurate quantification of CHL and BEN without chromatographic separation and thus provide a simple, precise and economical approach for routine quality control analysis.
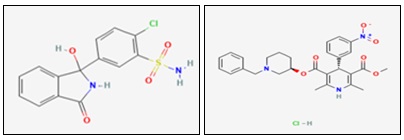
FIG. 1: MOLECULAR STRUCTURE OF (A) CHLORTHALIDONE AND (B) BENIDIPINE HYDROCHLORIDE
Literature Review: A detailed literature survey revealed that various analytical methods like UV 4-12 spectrophotometric, HPLC 11-12, RP-HPLC 14-18, HPTLC 19, and methods have been reported for estimation of BEN and CHL individually or in combination with other drugs. However, no reports are available describing the application of Ratio Subtraction coupled with Extended Ratio Subtraction (RS-ERS), Ratio Subtraction coupled with Constant Multiplication (RSCM), and Ratio Subtraction coupled with Spectrum Subtraction (RS-SS) methods for simultaneous estimation of this combination in the available literature. Hence, the present study was undertaken to develop and validate these methods as per the ICH Q2(R2) guidelines along with the evaluation of their greenness and environmental sustainability.
MATERIALS AND METHODS:
Instrumentation: A SHIMADZU UV-2700 double-beam UV-Visible spectrophotometer with 1 cm matched quartz cells was used for spectral measurements. The spectrophotometer was set to a bandwidth of 1 nm, a scan speed of 400 nm/min, and a data interval of 0.5 nm. A Wensar electronic balance (Model MAB 220) was used for sample weighing. Calibrated glassware was used for the entire procedure. A solvent blank was used for baseline correction prior to the scan.
Reagents and Chemicals: Benidipine Hydrochloride (BEN), having a percent purity of 99.51%, and Chlorthalidone (CHL), having a percent purity of 98.93%, were received as gift samples from Ravenbhel Healthcare (P) Ltd, Bari-Brahmana, Jammu, and Acme Foundation, Nalagarh, Himachal Pradesh, respectively. HPLC-grade methanol was purchased from Rankem (Avantor).
Marketed Formulation: BENIDIN CH 6.25 mg, manufactured by Mascot Health Series Pvt Ltd, was purchased from the local market. Each Film-coated bilayered tablet contains 4 mg of Benidipine Hydrochloride and 6.25 mg of Chlorthalidone.
Preparation of Solution:
Standard Stock Solution of CHL (1000 µg/mL): A standard stock solution was prepared by accurately weighing 100 mg of CHL. The weighed drug was transferred into a 100 mL volumetric flask and initially dissolved in approximately 50 mL of methanol. The solution was then diluted up to the mark with the same solvent to obtain a final concentration of 1000 µg/mL.
Working Standard Solution of CHL (100 µg/mL): A 10 mL volume was pipetted from the standard stock solution of CHL 1000 ug/mL and transferred into a 100 mL volumetric flask. The solution was then diluted to the mark with methanol to obtain a final concentration of 100 µg/mL.
Standard Stock Solution of BEN (1000 µg/mL): A standard stock solution was prepared by accurately weighing 100 mg of BEN. The weighed drug was transferred into a 100 mL volumetric flask and initially dissolved in approximately 50 mL of methanol. The solution was then diluted up to the mark with the same solvent to obtain a final concentration of 1000 µg/mL.
Working Standard Solution of BEN (100 µg/mL): A 10 mL volume was pipetted from the standard stock solution of BEN 1000ug/mL and transferred into a 100 mL volumetric flask. The solution was then diluted to the mark with methanol to obtain a final concentration of 100 µg/mL.
Preparation of Tablet Sample Solution for Analysis: Twenty BENIDIN CH 6.25 tablets were accurately weighed (3.84g), and the average tablet weight was calculated (0.192g). Tablets were then crushed into fine powder using a mortar and pestle, and a quantity of tablet powder equivalent to 4 mg of BEN (6.2 mg of CHL) was transferred to a 100 mL volumetric flask. Approximately 50 mL of methanol was added, and the mixture was sonicated for 45 min to ensure complete extraction of the drugs. The volume was then adjusted up to the mark with methanol to obtain a stock solution containing BEN and CHL at concentrations of 4 µg/mL and 6.25 µg/mL, respectively. The resulting solution was centrifuged at 3800 rpm for 15 min, and the supernatant was collected for further analysis.
Note: Methanol was used only for the preparation of stock and working standard solutions of BEN and CHL and for preparation of tablet sample solution. All subsequent dilutions, method development, assay, and validation studies were carried out using the optimized distilled water:methanol (50:50, v/v) solvent system.
Method Development for Simultaneous Estimation of Benidipine Hydrochloride and Chlorthalidone in Water: Methanol (50:50 v/v):
Ratio Subtraction and Extended Ratio Subtraction Method (RS-ERS) 18-20: The RS-ERS method is a spectrophotometric technique applicable for the simultaneous estimation of binary drug combinations exhibiting overlapping absorption spectra, wherein one component possesses a more extended spectral profile than the other. In the selected CHL and BEN combination, BEN exhibited a more extended absorption spectrum, while CHL showed a less extended spectrum. Therefore, the RS-ERS method was employed for the recovery and quantification of the individual spectra of CHL and BEN without prior separation.
Ratio Subtraction (RS): For the determination of CHL,
Step 1: The absorption spectrum of the mixture (CHL + BEN) was divided by the spectrum of a selected concentration of BEN (BEN′), used as a divisor.
CHL+BEN) / BEN = CHL / BEN + BEN / BEN = CHL / BEN + Constant (Equation 1)
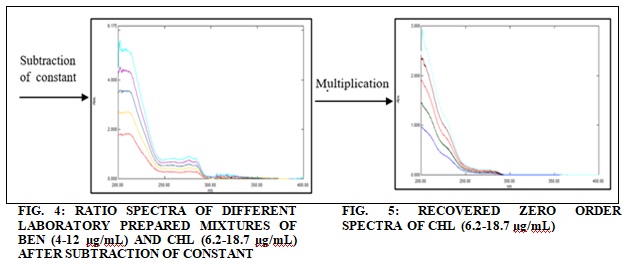
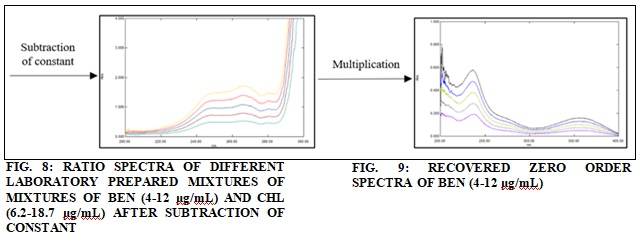
Step 2: The obtained ratio spectrum consisted of CHL/BEN′ and a constant corresponding to BEN/BEN′. The constant value was measured from the plateau region and subsequently subtracted from the ratio spectrum.
CHL / BEN + Constant – Constant = CHL / BEN (Equation 2)
Step 3: Multiplication of the resulting spectrum by the divisor (BEN′) yielded the original zero-order spectrum of CHL.
CHL / BEN × BEN = CHL (Equation 3)
The recovered spectrum was used for quantitative estimation of CHL at 275 nm
Determination of CHL by RS:
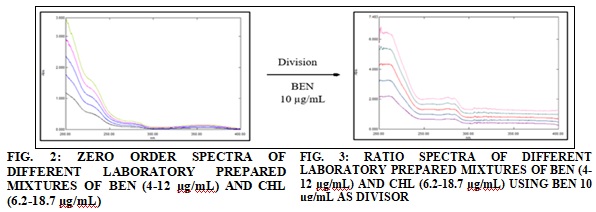
Extended Ratio Subtraction (ERS): For the determination of BEN.
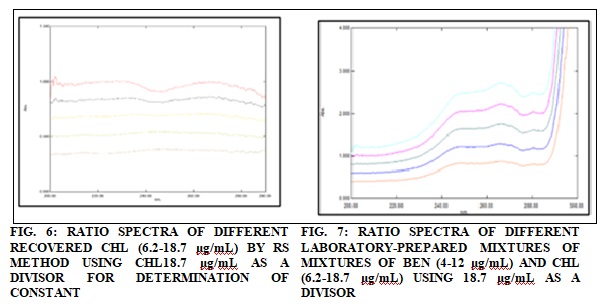
Step 1: The recovered zero-order spectrum of CHL by RS was divided by a spectrum of a selected concentration of CHL (CHL′), used as the divisor to obtain a constant value corresponding to CHL/CHL′.
CHL / CHL = Constant (Equation 4)
Step 2: Subsequently, the spectrum of the mixture (CHL + BEN) was divided by the same divisor (CHL′), producing a ratio spectrum consisting of BEN/CHL′ and the constant obtained previously.
CHL+ BEN / CHL = CHL / CHL + BEN / CHL = BEN / CHL + Constant (Equation 5)
Step 3: The previously obtained constant was subtracted from the ratio spectra of the laboratory-prepared mixtures, which had been divided by the selected CHL divisor concentration (18.7 µg/mL).
BEN / CHL + Constant - Constant = BEN / CHL (Equation 6)
Step 4: The resulting ratio spectra were then multiplied by the selected CHL divisor spectrum (18.7 µg/mL) to regenerate the original zero-order spectra of BEN (Eq. 7).
BEN / CHL × CHL (Equation 7)
Thus, the RS-ERS method enables the selective recovery of the individual zero-order spectra of CHL and BEN from their overlapping spectra, facilitating their simultaneous determination.
Determination of BEN by ERS Method:
Ratio Subtraction Coupled with Constant Multiplication (RS-CM) 19-21: The RSCM method is a simple and selective spectrophotometric technique employed for the analysis of binary mixtures with overlapping spectra. The method is based on the recovery of the spectrum of the component exhibiting the more extended spectrum through constant multiplication, followed by the determination of the second component by spectrum subtraction.
For the determination of BEN,
Step 1: The absorption spectrum of the mixture (CHL + BEN) was divided by the spectrum of a selected concentration of BEN (BEN′), used as a divisor. The resulting ratio spectrum consisted of CHL/BEN′ and a constant corresponding to BEN/BEN′.
CHL+ BEN / BEN = CHL / BEN + BEN / BEN = CHL / BEN + Constant (Equation 8)
Step 2: The constant value was measured from the plateau region and multiplied by the selected divisor (BEN′) to recover the original zero-order spectrum of BEN (Equation 9).
BEN × BEN / BEN = BEN (Equation 9)
Determination of BEN by RSCM:
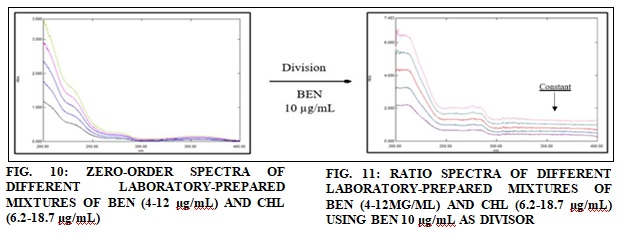
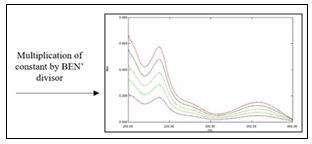
FIG. 12: RECOVERED ZERO-ORDER SPECTRA OF BEN (4-12μg/mL)
For the determination of CHL,
Step 3: The recovered zero-order spectrum of BEN was subtracted from the absorption spectrum of the mixture (CHL + BEN) to obtain the original zero-order spectrum of CHL.
(𝐶𝐻𝐿 +𝐵𝐸𝑁)−𝐵𝐸𝑁 =𝐶𝐻𝐿(𝐸𝑞𝑢𝑎𝑡𝑖𝑜𝑛 10)
Determination of CHL by RSCM:
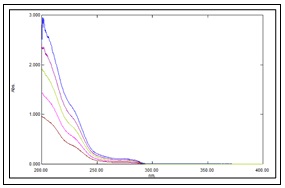
FIG. 13: RECOVERED ZERO-ORDER SPECTRA OF CHL (6.2-18.7 μg/mL)
Ratio Subtraction Coupled with Spectrum Subtraction (RS-SS) 18-19: CHL was determined using the RS method.
For the determination of BEN,
Step 1: The recovered zero-order spectrum of CHL was subtracted from the absorption spectrum of the mixture, resulting in the recovery of the original zero-order spectrum of BEN.
(𝐶𝐻𝐿 +𝐵𝐸𝑁)−𝐶𝐻𝐿 =𝐵𝐸𝑁 (Equation 11)
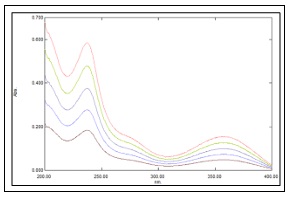
FIG. 14: RECOVERED ZERO-ORDER SPECTRA OF BEN (4-12 μg/mL)
Analytical Method Validation: The proposed analytical methods were validated in accordance with the recommendations of the ICH Q2(R2) guidelines. The following parameters, such as linearity and range, specificity, precision, accuracy, LOD, LOQ, robustness, and assay, were analysed.
Linearity and Range: The linearity of BEN and CHL was evaluated over the concentration ranges of 4–12 µg/mL and 6.2–18.7 µg/mL, respectively. Five concentration levels of BEN (4, 6, 8, 10, and 12 µg/mL) and CHL (6.2, 9.3, 12.5, 15.6, and 18.7 µg/mL) were prepared separately in triplicate in 10 mL volumetric flasks. Appropriate aliquots of BEN (0.4, 0.6, 0.8, 1.0, and 1.2 mL) and CHL (0.62, 0.93, 1.25, 1.56, and 1.87 mL) were withdrawn from their respective working standard solutions (100 µg/mL) and diluted to volume with a solvent system comprising distilled water and methanol (50:50, v/v). The UV spectra were recorded using a UV–Visible spectrophotometer over the wavelength range of 200–400 nm.
For the RS-ERS, RSCM, and RS-SS methods, the absorbances of BEN and CHL were measured at 237 nm and 275 nm, respectively. Calibration curves were constructed by plotting concentration versus absorbance, and the corresponding regression equations were obtained for both drugs.
Specificity: The specificity of the proposed methods was evaluated by comparing the spectral characteristics of standard solutions of BEN and CHL at assay concentrations with those obtained from the corresponding pharmaceutical formulation containing the same concentrations.
A laboratory-prepared mixture containing BEN (8 µg/mL) and CHL (12.5 µg/mL) in a ratio of 1:1.56 was prepared by accurately transferring 0.8 mL of BEN working standard solution
(100 µg/mL) and 1.25 mL of CHL working standard solution (100 µg/mL) into a 10 mL volumetric flask and diluting to volume with a solvent system comprising distilled water and methanol (50:50, v/v).
Similarly, a formulation mixture containing BEN (8 µg/mL) and CHL (12.5 µg/mL) in a ratio of 1:1.56 was prepared from BENIDIN CH 6.25 tablets. For all three proposed methods, 2 mL of the tablet solution was accurately transferred to a 10 mL volumetric flask and diluted to volume with a solvent system comprising distilled water and methanol (50:50, v/v), yielding final concentrations of BEN (8 µg/mL) and CHL (12.5 µg/mL).Both the laboratory-prepared mixture and formulation sample solutions were scanned over the wavelength range of 200–400 nm using a UV-Visible spectrophotometer.
Precision: Intra-day and inter-day precision studies were performed at the assay concentration level for both drugs. The study was carried out by analyzing six replicate samples, and the results were expressed as percentage relative standard deviation (%RSD).
For all the proposed methods (RS-ERS, RSCM, and RS-SS), 2 mL of the tablet solution was accurately transferred to a 10 mL volumetric flask and diluted to volume with a solvent system comprising distilled water and methanol (50:50, v/v), yielding final concentrations of BEN (8 µg/mL) and CHL (12.5 µg/mL). The solutions were then analyzed using a UV–Visible spectrophotometer over the wavelength range of 200–400 nm. For the RS-ERS method, CHL was determined using 10 µg/mL BEN as the selected divisor concentration, and absorbance was measured at 275 nm.
Similarly, BEN was determined using 18.7 µg/mL CHL as the selected divisor concentration, and absorbance was measured at 237 nm.
For the RSCM method, BEN was determined using 10 µg/mL BEN as the selected divisor concentration, and absorbance was measured at 237 nm. CHL was determined by subtracting the recovered spectrum of BEN from the absorption spectrum of the mixture, and absorbance was measured at 275 nm.
For the RS-SS method, CHL was determined using 10 µg/mL BEN as the selected divisor concentration, and absorbance was measured at 275 nm. Similarly, BEN was determined by subtracting the recovered spectrum of CHL from the absorption spectrum of the mixture, and absorbance was measured at 237 nm.
Accuracy: The accuracy assessment was carried out at 80%, 100%, and 120% concentration levels. The accuracy studies were performed separately by the standard addition method, and the percent recovery was calculated.
A base solution containing BEN and CHL at concentrations of 4 µg/mL and 6.2 µg/mL, respectively, was prepared by pipetting 1.5 mL of the tablet stock solution into a 10 mL volumetric flask and diluting to volume with a solvent system comprising distilled water and methanol (50:50, v/v). This was then analysed using RS-ERS, RSCM, and RS-SS methods. To this initial concentration of BEN (4 µg/mL) and CHL (6.2 µg/mL) addition of 0.32mL, 0.4 mL, 0.48mL was carried out from working standard solution of BEN and (100µg/mL) and addition of 0.49mL, 0.62 mL, 0.74mL was carried out from Working standard solution of CHL (100 µg/mL) respectively to obtain 7.2, 8, 8.8µg/mL of concentration of BEN and 11.1, 12.4, and 13.6 µg/mL of concentration of CHL.
For the RS-ERS method, CHL was determined using 10 µg/mL BEN as the selected divisor concentration, and absorbance was measured at 275 nm. Similarly, BEN was determined using 18.7 µg/mL CHL as the selected divisor concentration, and absorbance was measured at 237 nm.
For the RSCM method, BEN was determined using 10 µg/mL BEN as the selected divisor concentration, and absorbance was measured at 237 nm. CHL was determined by subtracting the recovered spectrum of BEN from the absorption spectrum of the mixture, and absorbance was measured at 275 nm.
For the RS-SS method, CHL was determined using 10 µg/mL BEN as the selected divisor concentration, and absorbance was measured at 275 nm. Similarly, BEN was determined by subtracting the recovered spectrum of CHL from the absorption spectrum of the mixture, and absorbance was measured at 237 nm.
Assay of Marketed Formulation: The validated RS-ERS, RS-CM, and RS-SS methods were employed for the quantitative estimation of BEN and CHL in the marketed tablet formulation, Benidin-CH 6.25. The analysis was performed to determine the percentage label claim of both drugs.
For RS-ERS method, CHL and BEN were determined using 10 µg/mL BEN and 18.7 µg/mL CHL as divisor concentrations, respectively, with absorbance measurements performed at 275 nm and 237 nm.
For RSCM method, BEN was quantified using 10 µg/mL BEN as the divisor concentration at 237 nm, while CHL was determined from the recovered spectrum obtained after subtraction of BEN from the mixture spectrum and measured at 275 nm.
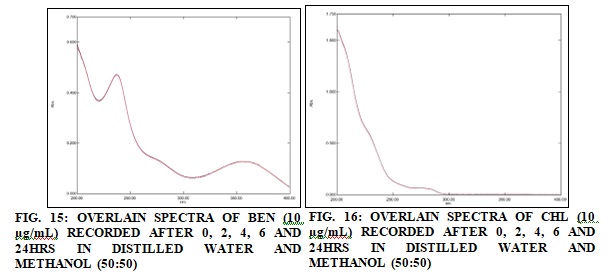
For the RS-SS method, CHL was estimated using 10 µg/mL BEN as the divisor concentration at 275 nm, whereas BEN was determined from the recovered spectrum after subtraction of CHL from the mixture spectrum and measured at 237 nm.
RESULTS AND DISCUSSION:
Selection of Solvent: For the selection of a suitable solvent, the Certificate of Analysis (COA) and the monographs of Benidipine hydrochloride (BEN) and Chlorthalidone (CHL) in the Indian Pharmacopoeia (IP) and Japanese Pharmacopoeia (JP) were referred to for information regarding their solubility characteristics. The recommended solvents included methanol and other organic solvents. However, to develop a greener and more sustainable analytical method, different combinations of distilled water and methanol were investigated. Among the solvent systems evaluated, both BEN and CHL were found to be sufficiently soluble and stable in distilled water:methanol (50:50, v/v), whereas BEN exhibited instability in solvent systems containing a higher proportion of water.
Therefore, considering solubility, stability, and green analytical chemistry principles, distilled water:methanol (50:50, v/v) was selected as the solvent system for the development and validation of the proposed spectrophotometric methods.
Determination of Lambda max: The UV absorption spectra of BEN and CHL (10 µg/mL each) were recorded over the range of 200–400 nm, and the overlain spectra are shown in Fig. 17. BEN exhibited a maximum absorbance (λmax) at 237 nm, whereas CHL showed a λmax at 275 nm.
These wavelengths were selected for further method development and quantitative analysis.
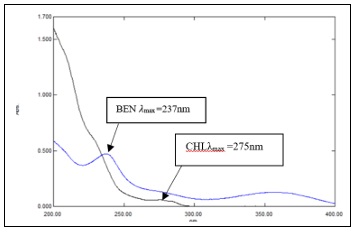
FIG. 17: OVERLAIN SPECTRA OF BEN (10µG/ML) AND CHL (10 µg/mL) IN DISTILLED WATER AND METHANOL (50:50)
Specificity: Specificity of the developed RS-ERS, RS-SS, and RSCM methods was evaluated by comparing the UV spectra of the laboratory-prepared mixture of BEN and CHL with those obtained from the tablet formulation. The spectra of the laboratory-prepared mixture were found to be closely overlapped with those of tablet formulation, indicating the absence of interference from formulation excipients. No additional spectral features or significant changes in absorbance were observed, confirming the specificity and selectivity of the proposed methods for the simultaneous estimation of BEN and CHL. The corresponding spectra are presented in the figure below.
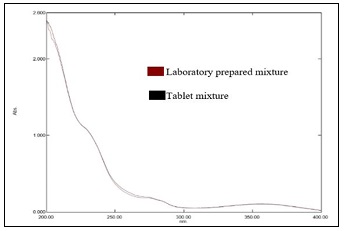
FIG. 18: OVERLAIN SPECTRA OF LABORATORY-PREPARED MIXTURE AND MARKETED FORMULATION
Selection and Optimization of Divisor Concentration:
TABLE 1: SELECTION OF BEN DIVISOR FOR DETERMINATION OF CHL
| BEN Divisor (µg/mL) | Ratio spectra quality | Baseline noise | Recovery of CHL spectra | Correlation with standard spectra (r²) | Observation |
| 4 | Unsatisfactory | High | Slightly affected | 0.9991 | Low divisor amplified spectral noise |
| 6 | Acceptable | Moderate | Acceptable | 0.9993 | Improved but slight baseline fluctuations were observed |
| 8 | Good | Low | Good | 0.9995 | Good spectral recovery |
| 10 | Excellent | Minimal | Excellent | 0.9996 | Selected as an optimum divisor |
| 12 | Good | Low | Slight reduction in sensitivity | 0.9993 | A higher divisor reduced spectral sensitivity |
TABLE 2: SELECTION OF CHL DIVISOR FOR DETERMINATION OF BEN
| CHL Divisor (µg/mL) | Ratio spectra quality | Baseline noise | Recovery of BEN spectra | Correlation with standard spectra (r²) | Observation |
| 6.2 | Acceptable | Moderate | Acceptable | 0.9998 | Slight baseline fluctuation observed |
| 9.3 | Good | Low | Good | 0.9998 | Good recovery obtained |
| 12.5 | Good | Low | Good | 0.9997 | Comparable performance |
| 15.6 | Very good | Low | Very good | 0.9998 | High-quality spectra obtained |
| 18.8 | Excellent | Minimal | Excellent | 0.9999 | Selected as optimum divisor |
The optimum divisor concentration was established during the optimization of the RS-ERS method by evaluating different divisor concentrations of BEN and CHL. CHL (18.7 µg/mL) and BEN (10 µg/mL) exhibited the best spectral quality, minimal baseline noise, excellent recovery, and the highest agreement with the corresponding standard spectra. Since the RS-CM and RS-SS methods are based on the same ratio subtraction principle and utilize identical divisor spectra, these optimized divisor concentrations were adopted for all subsequent methods to ensure consistency in spectral processing and analytical performance.
TABLE 3: ASSAY COMPARISON OF TABLET EXTRACT AND LABORATORY MIXTURE
| Drug | Sample | Wavelength (nm) | Label | Found | % Label Claim |
| BEN | Laboratory mixture | 237 | 4 | 4.024 | 100.600 |
| CHL | Laboratory mixture | 275 | 6.25 | 6.228 | 99.648 |
| BEN | Tablet extract | 237 | 4 | 4.024 | 100.600 |
| CHL | Tablet extract | 275 | 6.25 | 6.403 | 102.448 |
Note: The assay limit as per JP for Benidipine hydrochloride is NLT 95 % and NMT 105 % than of the stated amount, and the assay limit as per IP for chlorthalidone is NLT 92.5 % and NMT 107.5% of the stated amount.
Placebo studies could not be performed due to the unavailability of the exact excipient composition of the marketed formulation. This represents a limitation of the present study, as interference from individual excipients could not be evaluated using a placebo matrix.
Therefore, specificity was assessed by comparing the marketed tablet formulation with the laboratory prepared mixture, and no significant interference was observed indicating that proposed methods are sufficiently specific for the simultaneous estimation of BEN and CHL. The inclusion of a synthetic placebo containing commonly used tablet excipients or a representative excipient blend would provide a more comprehensive assessment of specificity.
Linearity and Calibration Curve: The linearity of the developed RS-ERS, RS-CM, and RS-SS methods was evaluated using five concentration levels of BEN (4, 6, 8, 10, and 12 µg/mL) and CHL (6.2, 9.3, 12.5, 15.6, and 18.7 µg/mL), prepared from their respective working standard solutions. Calibration curves were constructed by plotting absorbance against concentration.
Both analytes exhibited excellent linearity over the concentration ranges of 4-12 µg/mL for BEN and 6.2-18.7 µg/mL for CHL. The correlation coefficient (r²) was found to be 0.9996 for both BEN and CHL, confirming the linearity of the proposed methods and their suitability for quantitative analysis within the selected ranges.
TABLE 4: LINEARITY STUDY OF BEN AND CHL IN DISTILLED WATER: METHANOL (50:50 V/V)
| Parameters | BEN | CHL |
| Range | 4-12 µg/mL | 6.2-18.7 µg/mL |
| Wavelength | 237nm | 275nm |
| Correlation Coefficient | 0.9996 | 0.9996 |
| Slope | 0.0492 | 0.0057 |
| Intercept | -0.013 | 0.0025 |
Note: the same set of calibration standards was employed for the evaluation of linearity in RS-ERS, RSCM and, RS-SS methods, as all three methods are based on mathematical processing of the same zero-order absorption spectra rather than independent instrumental measurements. Consequently, the same concentration ranges, analytical wavelength, and calibration curve were used for all three methods.
Range: The range was established as 4-12 µg/mL for BEN and 6.2-18.7 µg/mL for CHL. The proposed methods were successfully validated throughout these concentration ranges.
Limit of Detection (LOD) and Limit of Quantification (LOQ): LOD and LOQ were determined in accordance with ICH Q2(R2) guidelines based on the standard deviation of the response (σ) and the slope (S) of the calibration curve. The calculations were performed using the following expressions:
LOD = (3.3 σ) / S
LOQ = (10 σ) / S
For BEN, the LOD and LOQ were found to be 0.29 µg/mL and 0.87 µg/mL, respectively. For CHL, the corresponding values were 1.10 µg/mL and 3.34 µg/mL, respectively. The obtained results confirm that the proposed UV spectrophotometric method exhibits adequate sensitivity for the quantification of BEN and CHL at low concentration levels.
Precision: The intra-day and inter-day precision studies were carried out at the assay concentration levels of BEN (8 µg/mL) and CHL (12.5 µg/mL). Six replicate analyses were performed using suitably diluted sample solutions prepared from the marketed formulation. The concentrations of BEN and CHL were determined, and the results were expressed as percentage relative standard deviation (% RSD). The % RSD values obtained for both intra-day and inter-day precision studies were found to be less than 2%, indicating that the proposed methods are precise and reproducible for the simultaneous estimation of BEN and CHL. The results are presented in Table 3.
TABLE 5: PRECISION STUDY OF BEN AND CHL BY RS-ERS, RSCM, AND RS-SS (N = 6)
| Methods | Parameters | BEN | CHL | ||
| Mean Conc. SD | %RSD | Mean Conc. SD | %RSD | ||
| RS-ERS | Intra-Day | 8.109 ± 0.115 | 1.419 | 12.455 ± 0.184 | 1.478 |
| Inter-Day | 8.089 ± 0.094 | 1.168 | 12.572 ± 0.239 | 1.630 | |
| RS-CM | Intra-Day | 8.136 ± 0.101 | 1.252 | 12.572 ± 0.205 | 1.633 |
| Inter-Day | 8.132 ± 0.090 | 1.110 | 12.488 ± 0.181 | 1.452 | |
| RS-SS | Intra-Day | 8.085 ± 0.113 | 1.398 | 12.455± 0.184 | 1.478 |
| Inter-Day | 8.079 ± 0.125 | 1.565 | 12.572± 0.239 | 1.630 | |
Accuracy: The accuracy of the developed RS-ERS, RS-CM, and RS-SS methods was assessed using the standard addition method at 80%, 100%, and 120% levels of the assay concentration. Appropriate quantities of BEN and CHL standards were spiked into the pre-analyzed sample solution, and the recovery studies were carried out in triplicate. The percentage recoveries obtained for both analytes were within the range of 98–102%, with % RSD values below 2% across all three levels. The results indicate that the proposed methods are accurate and suitable for the routine quantitative analysis of BEN and CHL in pharmaceutical dosage forms. The detailed results are presented in Table 4, 5, and 6.
TABLE 6: RESULTS OF THE ACCURACY STUDY FOR BEN AND CHL BY RS-ERS
| Level of assay conc. | Amount of initial concentration in (µg/mL) | Amount of standard drug added (µg/mL) | Final concentration (µg/mL) | Amount of standard drug recovered
(µg/mL) |
%Recovery Mean ± SD, %RSD (n=3) | |||||
| BEN | CHL | BEN | CHL | BEN | CHL | BEN | CHL | BEN | CHL | |
| 80% | 4 | 6.2 | 3.2 | 4.9 | 7.2 | 11.1 | 3.373 | 5.087 | 101.009 ±
0.558,0.552 |
101.0243 ±
0.824, 0.816 |
| 100% | 4 | 6.2 | 4 | 6.2 | 8 | 12.4 | 4.195 | 6.252 | 101.126 ± 1.500,
1.483 |
100.664 ± 0.850,0.844 |
| 120% | 4 | 6.2 | 4.8 | 7.4 | 8.8 | 13.6 | 5.171 | 7.602 | 101.391± 0.524, 0.517 | 101.087 ± 0.511,0.505 |
TABLE 7: RESULTS OF THE ACCURACY STUDY FOR BEN AND CHL BY RSCM
| Level of assay conc. | Amount of initial concentration in (µg/mL) | Amount of standard drug added | Final concentration | Amount of standard drug recovered | % Recovery Mean± SD, %RSD | |||||
| BEN | CHL | BEN | CHL | BEN | CHL | BEN | CHL | BEN | CHL | |
| 80% | 4 | 6.2 | 3.2 | 4.9 | 7.2 | 11.1 | 3.374 | 4.769 | 101.638±
0.320, 0.314 |
101.106± 0.604,
0.598 |
| 100% | 4 | 6.2 | 4 | 6.2 | 8 | 12.4 | 4.207 | 6.434 | 100.932± 0.767,
0.760 |
101.156± 0.306,
0.303 |
| 120% | 4 | 6.2 | 4.8 | 7.4 | 8.8 | 13.6 | 4.851 | 7.426 | 100.631±
0.333, 0.331 |
100.717±
0.535, 0.531 |
TABLE 8: RESULTS OF ACCURACY STUDY FOR BEN AND CHL BY RS-SS
| Level of assay conc. | Amount of initial concentration in (µg/mL) | Amount of standard drug added (µg/mL) | Final concentration (µg/mL) | Amount of standard drug recovered
(µg/mL) |
%Recovery Mean ± SD, %RSD (n=3) | |||||
| BEN | CHL | BEN | CHL | BEN | CHL | BEN | CHL | BEN | CHL | |
| 80% | 4 | 6.2 | 3.2 | 4.9 | 7.2 | 11.1 | 3.292 | 5.087 | 101.1893±
0.478, 0.468 |
101.0243 ±
0.824, 0.816 |
| 100% | 4 | 6.2 | 4 | 6.2 | 8 | 12.4 | 4.126 | 6.252 | 101.118±
0.471, 0.463 |
100.664 ± 0.850,
0.844 |
| 120% | 4 | 6.2 | 4.8 | 7.4 | 8.8 | 13.6 | 4.924 | 7.602 | 101.386±
0.433, 0.427 |
101.087 ±
0.511, 0.505 |
Assay of Marketed Formulation: To assess the applicability of the validated RS-ERS, RS-CM, and RS-SS methods, the marketed tablet formulation Benidin-CH 6.25 containing BEN and CHL was analysed. The assay results were found to be in close agreement with the labelled claim, which indicates that the proposed methods can be effectively utilized for the routine simultaneous estimation of BEN and CHL in pharmaceutical formulations. The obtained results are presented in Table 7.
TABLE 9: ASSAY OF BEN AND CHL
| Parameters | Acceptance Criteria | RS-ERS | RS-CM | RS-SS | |||
| BEN | CHL | BEN | CHL | BEN | CHL | ||
| Assay | (n=3) | Average ± SD | Average ± SD | Average ± SD | |||
| % Content | BEN: 95- 105%
CHL:92.5-107.5% |
101.05±
0.692 |
101.824±1.333 | 101.056± 0.697 | 100.453±1.247 | 101.059± 0.692 | 100.453±1.577 |
TABLE 10: ROBUSTNESS STUDY OF RS-SS FOR BEN AND CHL
| Parameters | Condition | %Assay of BEN (Average ± SD) | %RSD | %Assay of CHL (Average ± SD) | %RSD |
| Analytical wavelength | 235 nm | 100.76 ± 0.827 | 0.810 | 101.246 ± 0.912 | 0.912 |
| 236 nm | 100.76 ± 0.865 | 0.813 | 101.226 ± 0.920 | 0.914 | |
| 237 nm | 101.12 ± 0.762 | 0.756 | 101.668 ± 0.889 | 0.873 | |
| 238 nm | 100.89 ± 0.796 | 0.789 | 101.462 ± 0.952 | 0.943 | |
| 239 nm | 100.79 ± 0.721 | 0.768 | 101.572 ± 0.923 | 0.840 | |
| BEN divisor concentration | 8 µg/mL | 100.69 ± 0.841 | 0.833 | 101.159 ± 0.904 | 0.859 |
| 10 µg/mL | 101.12 ± 0.766 | 0.754 | 101.684± 0.882 | 0.874 | |
| 12µg/mL | 100.91 ± 0.723 | 0.712 | 101.393± 0.935 | 0.926 |
TABLE 11: ROBUSTNESS STUDY OF RS-ERS FOR BEN AND CHL
| Parameters | Condition | %Assay of BEN (Average±SD) | %RSD | %Assay of CHL
(Average± SD) |
%RSD |
| Analytical wavelength | 235 nm | 100.762 ± 0.812 | 0.840 | 101.195 ± 0.928 | 0.913 |
| 236 nm | 100.839 ± 0.769 | 0.758 | 101.422 ± 0.884 | 0.874 | |
| 237 nm | 101.046 ± 0.696 | 0.683 | 101.825± 0.917 | 0.898 | |
| 238 nm | 100.924 ± 0.733 | 0.729 | 101.583 ± 0.936 | 0.926 | |
| 239 nm | 100.871 ± 0.782 | 0.772 | 101.318 ± 0.986 | 0.955 | |
| BEN divisor concentration | 8µg/mL | 100.728 ± 0.826 | 0.816 | 101.281± 0.856 | 0.985 |
| 10 µg/mL | 101.066 ± 0.692 | 0.684 | 101.829± 0.961 | 0.869 | |
| 12 µg/mL | 100.983 ± 0.778 | 0.766 | 101.453 ± 0.869 | 0.854 | |
| CHL divisor concentration | 12.4µg/mL | 100.827 ± 0.803 | 0.791 | 101.348± 0.857 | 0.869 |
| 15.6µg/mL | 101.046 ± 0.698 | 0.684 | 101.823± 0.941 | 0.893 | |
| 18.7µg/mL | 100.995 ± 0.796 | 0.753 | 101.415± 0.983 | 0.929 |
TABLE 12: ROBUSTNESS STUDY OF RSCM FOR BEN AND CHL
| Parameters | Condition | %Assay of BEN (Average ±SD) | %RSD | %Assay ofCHL
(Average ± SD) |
%RSD |
| Analytical wavelength | 235 nm | 100.723 ± 0.812 | 0.803 | 101.153± 0.923 | 0.913 |
| 236 nm | 100.891 ± 0.764 | 0.755 | 101.429± 0.884 | 0.875 | |
| 237 nm | 101.060 ± 0.695 | 0.684 | 101.828 ± 0.914 | 0.892 | |
| 238 nm | 100.944 ± 0.731 | 0.722 | 101.582± 0.931 | 0.922 | |
| 239 nm | 100.812 ± 0.781 | 0.771 | 101.313 ± 0.969 | 0.953 | |
| BEN divisor concentration | 8 µg/mL | 100.66 ± 0.854 | 0.843 | 101.87 ± 0.952 | 0.936 |
| 10 µg/mL | 101.05 ± 0.714 | 0.707 | 102.74 ± 0.960 | 0.954 | |
| 12 µg/mL | 100.88 ± 0.742 | 0.734 | 102.13 ± 0.882 | 0.863 | |
| Constant region selection
|
360-390 nm | 100.952 ± 0.770 | 0.764 | 102.566± 0.912 | 0.891 |
| 365-395 nm | 101.053 ± 0.713 | 0.702 | 102.742± 0.960 | 0.932 | |
| 370-400 nm | 100.846± 0.790 | 0.782 | 102.357 ± 0.942 | 0.925 |
Robustness: The % assay values for BEN and CHL remained within acceptable limits despite deliberate variations in the analytical wavelength, divisor concentration, and the constant region selection.
The %RSD values were below 2% under all the tested conditions, demonstrating that the RS-ERS, RSCM, and RS-SS methods are robust and suitable for routine analysis.
Greenness Assessment: The environmental sustainability of the developed RS-ERS, RS-SS, and RS-CM spectrophotometric methods was evaluated using the Analytical GREEnness (AGREE) metric and the Complex Green Analytical Procedure Index (ComplexGAPI).
The AGREE tool assesses analytical procedures based on the 12 principles of Green Analytical Chemistry, while ComplexGAPI provides a comprehensive evaluation of the environmental impact associated with the entire analytical workflow. The AGREE assessment yielded an overall score of 0.76, indicating excellent compliance with the principles of Green Analytical Chemistry Fig. 19.
The high greenness score was attributed to the use of UV-visible spectrophotometry, which requires minimal sample preparation, low energy consumption, reduced solvent usage, and generates only a small amount of analytical waste.
The ComplexGAPI assessment Fig. 20 further confirmed the environmentally benign nature of the developed methods, with the pictogram predominantly displaying green and yellow zones, reflecting favourable environmental performance throughout the analytical procedure. The calculated E-factor was 0.02, indicating negligible waste generation and minimal environmental impact.
The input parameters used for the ComplexGAPI and AGREE assessments are summarized in Table 13 and 14, respectively. Overall, the results obtained from both greenness assessment tools demonstrate that the proposed analytical methods are environmentally sustainable and suitable for routine quality control analysis.
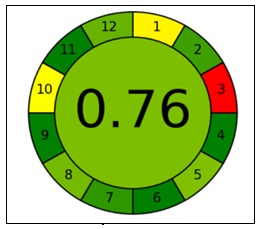
FIG. 19: GREENNESS ASSESSMENT (RS-ERS, RSCM, AND RS-CM) BY AGREE
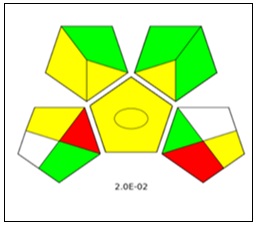
FIG. 20: GREENNESS ASSESSMENT (RS-ERS, RSCM, AND RS-CM) COMPLEX GAP
TABLE 13: INPUT PARAMETERS USED FOR THE COMPLEXGAPI
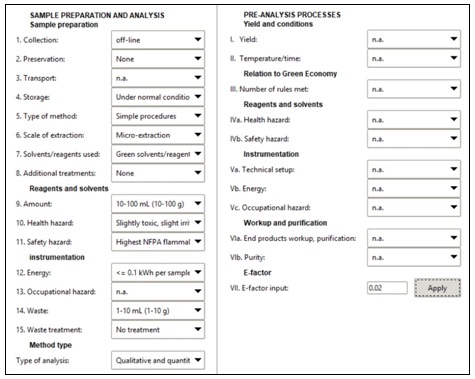
TABLE 14: INPUT PARAMETERS USED FOR THE AGREE
| Sr. no. | GAC Principle | Input |
| 1 | Direct analytical techniques should be applied to avoid sample treatment. | Off-line analysis |
| 2 | Minimal sample size and minimal number of samples are goals. | 0.2 |
| 3 | In-situ measurements should be performed/positioning of the analytical device. | Off-line |
| 4 | Integration of analytical processes and operations saves energy and reduces the use of reagents. Number of distinct steps. | 3 or fewer |
| 5 | Automated and miniaturized methods should be selected. | Semi-automatic; none or miniaturized |
| 6 | Derivatization should be avoided. | Not applicable |
| 7 | The generation of a large volume of analytical waste should be avoided, and proper management of analytical waste should be provided. | 0.2 |
| 8 | Multianalyte or multiparameter methods are preferred over methods using one analyte at a time. | 2 analytes determined per hr; 15 samples analysed per hr |
| 9 | The use of energy should be minimized. | UV–Visible spectrophotometry (0.1 kWh) |
| 10 | Reagents obtained from renewable sources should be preferred. | Some reagents are bio-based |
| 11 | Toxic reagents should be eliminated or replaced. | The method does not involve the use of toxic reagents |
| 12 | The safety of the operator should be increased. | Threats include High flammability of the solvent |
TABLE 15: COMPARISON OF PROPOSED UV METHODS WITH PREVIOUSLY REPORTED UV/HPLC/HPTLC METHODS FOR SIMULTANEOUS ESTIMATION OF BEN AND CHLORTHALIDONE CHL
| S. no. | Method (Reference) | Solvent System | Sensitivity (LOD/LOQ, µg/mL) | Simplicity | Analysis Time | Greenness | Novelty |
| 1 | Simultaneous Equation Method (Shaikhmulani et al., 2022, Human Journals) | Methanol: Water (90:10 v/v) | LOD: 5.22 (BEN), 7.82 (CHL); LOQ: 15.82 (BEN), 23.72 (CHL) | Simple two-wavelength UV calculation; no chromatographic separation required | Rapid, single UV scan, no run/retention time involved | Not evaluated; predominantly organic (90% methanol) solvent system | First reported UV method for this drug combination; no HPLC/HPTLC comparator existed at the time |
| 2 | RP-HPLC Method (Shaikhmulani et al., 2022, Indian J. Pharm. Drug Studies) | Methanol: 0.1% Orthophosphoric acid (45:55 v/v) | LOD: 2.05 (BEN), 7.71 (CHL); LOQ: 6.22 (BEN), 23.38 (CHL) | Requires HPLC instrumentation, C18 column, mobile-phase pumping and degassing | RT 1.09 min (BEN), 3.52 min (CHL); total run time 10 min | Not assessed; majority organic (methanol) mobile phase, higher solvent consumption | One of the earliest RP-HPLC methods reported for the combination |
| 3 | Stability-Indicating RP-HPLC (Devaka & Rao, 2020, Drug Invention Today) | 0.1 M NaH₂PO₄ buffer (pH 4.0) : Methanol (60:40 v/v) | LOD: 0.163 (BEN), 0.090 (CHL); LOQ: 0.543 (BEN), 0.299 (CHL) | HPLC-based; includes forced-degradation protocol (acid, base, peroxide, heat, sunlight, water) - more elaborate sample handling | RT 4.28 min (BEN), 5.54 min (CHL); total run time 8 min | Not evaluated; partial organic (40%) solvent use | First stability-indicating RP-HPLC method with full forced-degradation profiling |
| 4 | Green RP-HPLC with AQbD (Dharuman et al., 2023, Green Chem. Lett. Rev.) | Ethanol : KH₂PO₄ buffer, pH 3.5 (40:60 v/v) | LOD: 1.812 (BEN), 0.672 (CHL); LOQ: 5.493 (BEN), 2.037 (CHL) | HPLC-based with Quality-by-Design (central composite design) optimization — resource- and time-intensive method development | RT 3.1 min (CHL), 5.1 min (BEN) | Best among reported methods: AGREE 0.85, AES 93, GAPI predominantly green (ethanol replaces methanol/acetonitrile) | First AQbD-integrated green HPLC method for this combination |
| 5 | Stability-Indicating HPTLC (Singh, Parmar & Patel, 2026, Res. J. Pharm. Technol.) | Ethyl acetate : n-Hexane (7:3 v/v) | Range: 1000–5000 ng/spot (BEN), 3125–15625 ng/spot (CHL) | Requires HPTLC plates, sample spotting, densitometric scanning — additional equipment and manual steps | Batch analysis possible (multiple spots/plate), but plate development and scanning add to total cycle time | Not evaluated; uses hazardous organic solvents (ethyl acetate, n-hexane) | First stability-indicating HPTLC method for this combination |
| 6 | Proposed Methods: RS-ERS, RS-CM, RS-SS (Present study) | Distilled Water : Methanol (50:50 v/v) — reduced organic-solvent proportion vs. all reported methods | LOD: 0.29 (BEN), 1.10 (CHL); LOQ: 0.87 (BEN), 3.34 (CHL) (more sensitive than SE method; comparable to HPLC methods) | Simple UV spectrophotometric techniques; no chromatographic column, mobile-phase pump, or plate development needed; minimal sample preparation | Rapid; single UV scan per method, no retention/run time as in HPLC/HPTLC | AGREE score: 0.76; ComplexGAPI: predominantly green/yellow — confirmed eco-friendly with reduced solvent consumption | First application of three ratio-based resolution techniques (RS-ERS, RS-CM, RS-SS) to this drug pair — offering validated, sensitive, and greener alternatives without HPLC/HPTLC instrumentation |
CONCLUSION: Three UV spectrophotometric methods, namely RS-SS, RS-ERS, and RS-CM, were developed and validated for the simultaneous estimation of Benidipine Hydrochloride and Chlorthalidone in tablet dosage forms. A methanol:water (50:50 v/v) solvent system was selected, and measurements were carried out at 237 nm for BEN and 275 nm for CHL. The developed methods were validated in accordance with ICH Q2(R2) guidelines and were found to be linear, accurate, precise, robust, and sensitive. The methods were successfully applied to the assay of marketed formulations and demonstrated excellent greenness characteristics as confirmed by AGREE and ComplexGAPI assessments. The proposed methods were compared with previously reported UV, HPLC, and HPTLC methods and were found to offer greater sensitivity and superior greenness compared to the existing methods.
ACKNOWLEDGEMENT: The authors sincerely thank the Almighty for His blessings, guidance, and strength throughout the course of this research work. The authors gratefully acknowledge Goa College of Pharmacy for providing the facilities and resources required for carrying out this study. The authors express their heartfelt gratitude to Dr. Sachi Kudchadkar, Assistant Professor, Department of Pharmaceutical Analysis, Goa College of Pharmacy, for her expert guidance, valuable insights, and continuous support during the execution of this research work. The authors are thankful to Dr. Gopalkrishna Rao, Principal, Goa College of Pharmacy, for his encouragement and support. The authors also acknowledge Dr. Sanjay Pai P. N., Professor and Head, Department of Pharmaceutical Chemistry; Dr. Anand A. Mahajan, Professor; Dr. Adison Fernandes, Assistant Professor; and Mrs. Sweta Borkar, Assistant Professor, Department of Pharmaceutical Analysis, for their constructive suggestions and encouragement throughout the study.
CONFLICT OF INTEREST: The authors declare that they have no conflicts of interest to disclose.
REFERENCES:
- National Center for Biotechnology Information (NCBI): PubChem Compound Summary for CID 656667, Benidipine Hydrochloride. Bethesda (MD): National Library of Medicine (US), 2024. Available from: https://pubchem.ncbi.nlm.nih.gov/compound/656667.
- Yao K, Nagashima K and Miki H: Pharmacological, pharmacokinetic and clinical properties of Benidipine Hydrochloride, a novel long-acting calcium channel blocker. Journal of Pharmacological Sciences 2006; 100(4): 243-261.
- National Center for Biotechnology Information (NCBI): PubChem Compound Summary for CID 2732, Chlorthalidone. Bethesda (MD): National Library of Medicine (US), 2024. Available from: https://pubchem.ncbi.nlm.nih.gov/compound/2732 [Accessed on: 10 June 2024].
- Shaikhmulani HI, Tamboli AM, Kshirsagar RT and Suryavanshi HT: Simultaneous equation method for the estimation of Benidipine Hydrochloride and Chlorthalidone by UV spectrophotometry. International Journal of Pharmacy and Pharmaceutical Research 2022; 24(3): 406-417.
- Kumar M, Shukla AK, Bishnoi RS and Jain CP: Development of UV spectrophotometric method for the determination of Benidipine Hydrochloride by using Quality by Design (QbD) approach. International Journal of Applied Pharmaceutics 2018; 10(4): 92-97. DOI: 10.22159/ijap.2018v10i4.26623.
- Al-Japairai KA, Mahmood S, Abdul-Halim N and Almurisi SH: A new and rapid UV-visible spectrophotometric method for Benidipine Hydrochloride determination: Development and validation. Pharmaceutical Chemistry Journal 2023; 56(11): 1506-1511.
- Eswarudu MM, Babu PS, Reddy NS, Ouchitya G, Kumar BV and Naidu SB: Validated UV-spectrophotometric method for simultaneous estimation of Benidipine Hydrochloride and Telmisartan in bulk and pharmaceutical dosage form. European Journal of Biomedical and Pharmaceutical Sciences 2022; 9(10): 430-436.
- Bamgonde SS, Dulange KC, Kalshetti MS, Gaibu ZM and Gate NR: UV-spectrophotometric method development and validation for determination of Chlorthalidone in bulk and pharmaceutical dosage form. Asian J of Pharma Analysis and Medicinal Chemistry 2019; 7(1): 8-15.
- Jain A, Sanap H, Devkate R and Sangale S: UV spectrophotometric determination of Chlorthalidone in tablet dosage form by using single point standardization method. World Journal of Biology Pharmacy and Health Sciences 2024; 17(2): 209-213.
- Abdullah NS, Hassan MA and Hassan RO: Spectrophotometric determination of Chlorthalidone in pharmaceutical formulations using different order derivative methods. Arabian Journal of Chemistry 2016; 9(Suppl 2): S1567-S1574.
- Jain S and Jain R: Development and validation of a UV spectroscopic method for simultaneous estimation of Azelnidipine and Chlorthalidone in bulk and tablet dosage form with forced degradation studies. International Journal of Medical, Pharmaceutical and Health Sciences 2025; 2(1): 208-221.
- Darji H, Dedania Z, Dedania R and Jain V: Eco-friendly based HPLC and UV-spectrophotometric methods for simultaneous estimation of Efonidipine Hydrochloride Ethanolate and Chlorthalidone in their dosage form. Green Analytical Chemistry 2024; 8: 100092.
- Jagadeesh K and Annapurna N: Stability indicating method to analyze Benidipine and Chlorthalidone using HPLC technique: Establishment, validation and application to tablets. Pharmaceutical Sciences 2020; 26(1): 75-81. DOI: 10.34172/PS.2019.58.
- Devaka NVSK and Rao VM: Determination of benidipine and chlorthalidone content in tablets using stability-indicating reverse-phase high-performance liquid chromatography technique. Drug Invention Today 2020; 13(2): 235-241.
- Shaikhmulani H, Tamboli AM, Tamboli NA, Kshirsagar RT, Suryawanshi HT and Khandare O: RP-HPLC method development and validation for simultaneous estimation of Benidipine Hydrochloride and Chlorthalidone in pharmaceutical dosage form. Indian Journal of Pharmacy and Drug Studies 2022; 1(3): 102-107.
- Patel BD, Chaudhary A and Gami S: RP-HPLC method development and validation for simultaneous estimation of Benidipine Hydrochloride, Telmisartan and Chlorthalidone in tablet. Journal of Emerging Technologies and Innovative Research 2019; 6(3): 110-124.
- Megha JM, Patel BR and Patel JG: Analytical method development and validation of stability indicating RP-HPLC method for estimation of Benidipine HCl, Telmisartan and Chlorthalidone in tablet. International Journal of Research and Analytical Reviews 2019; 6(1): 865-873.
- Dharuman N, Lakshmi KS and Krishnan M: Environmental benign RP-HPLC method for the simultaneous estimation of anti-hypertensive drugs using analytical quality by design. Green Chemistry Letters and Reviews 2023; 16(1): 2214176. DOI: 10.1080/17518253.2023.2214176.
- Singh I, Parmar K and Patel S: Development and validation of stability indicating HPTLC method for simultaneous estimation of Benidipine Hydrochloride and Chlorthalidone in pharmaceutical dosage form. Research Journal of Pharmacy and Technology 2026; 19(6): 2869-2875. DOI: 10.52711/0974-360X.2026.00409.
- Mohammad MA, Mahrouse MA, Amer EA, Elharati NS and Michael AM: Simultaneous determination of enalapril maleate and nitrendipine in tablets using spectrophotometric methods manipulating ratio spectra. Spectrochimica Acta Part A: Molecular and Biomolecular Spectroscopy 2021; 244: 118894.
- Kinnerker A, Kumbharjuvekar C, Naik A and Kudchadkar S: Analytical method development and validation of univariate spectrophotometric methods for quantifying binary drug combination in hypertensive care. Journal of Pharmaceutical Research 15(10): 905-921. [Year/volume incomplete — see note below]
- Malathi DS, Pallavi M and Sunil Kumar: Instrumental Methods of Analysis. Lucknow: Thakur Publication Pvt Ltd, 2020.
- Kamal AH, El-Malla SF and Hammad SF: A review on UV spectrophotometric methods for simultaneous multicomponent analysis. European Journal of Pharmaceutical and Medical Research 2016; 3(2): 348-365.
- Ahmed MK, Michael AM, Hassan AS and Abbas SS: Different spectrophotometric methods manipulating ratio spectra for the assay of hydrocortisone acetate and clioquinol in their topical preparation. European Journal of Chemistry 2021; 12(3): 265-272. DOI: 10.5155/eurjchem.12.3.265-272.2093.
- American Chemical Society: 12 principles of green chemistry. Washington DC: ACS, 2024. Available from: https://www.acs.org/greenchemistry/principles/12-principles-of-green-chemistry.html
- Płotka-Wasylka J and Wojnowski W: Complementary green analytical procedure index (ComplexGAPI) and software. Green Chemistry 2021; 23(21): 8657-8665. DOI: 10.1039/D1GC02318G.
- Pena-Pereira F, Wojnowski W and Tobiszewski M: AGREE — Analytical GREEnness metric approach and software. Analytical Chemistry 2020; 92(14): 10076-10082. DOI: 10.1021/acs.analchem.0c01887.
How to cite this article:
Naik A, Kanolkar S, Kumbharjuvekar C and Kudchadkar S: UV spectral strategies for analytical method development of multicomponent drug formulation. Int J Pharm Sci & Res 2026; 17(11): 3550-66. doi: 10.13040/IJPSR.0975-8232.17(11).3550-66.
All © 2026 are reserved by International Journal of Pharmaceutical Sciences and Research. This Journal licensed under a Creative Commons Attribution-NonCommercial-ShareAlike 3.0 Unported License.
Article Information
22
3550-3566
1105 KB
7
English
IJPSR
A. Naik *, S. Kanolkar, C. Kumbharjuvekar and S. Kudchadkar
Department of Pharmaceutical Quality Assurance, Goa College of Pharmacy, Panaji, Goa, India.
naik22avani@gmail.com
26 June 2026
10 July 2026
25 July 2026
10.13040/IJPSR.0975-8232.17(11).3550-66
01 November 2026
 Download